References for the GEISA 2011 sub-database on line transition parameters
Details of changes since the 2003 edition of GEISA
| GEISA 2011 molecule numbering | ||||
The GEISA 2011 H2O update involves spectroscopic parameters from three different origins, i.e.:
– In the spectral region 500-7973 cm-1, the Toth’s JPL data available with their related description and references from the mak4sun workstation at. This represents a total of 36849 lines.
– In the 10 to 2000 cm-1 spectral region, for the normal isotopic species H216O, updated line parameters values computed using the results of Coudert et al. [1] related with line position and line intensity analyses of data up to the second triad as well as line strength measurements for ν2 band transitions. Using the spectroscopic parameters of this reference and the theoretical approach of Lanquetin et al. [2], a line list of 5624 entries was generated with a line intensity cut-off of 10-27cm-1/(molecule cm-2). This calculation and the line strength measurements of Ref. [1] revealed that experimental line strength values for transitions belonging to the ν2 band in the 1000 to 2000 cm-1 range were underestimated in previous measurement [3] for the strongest transitions in this region. This is illustrated quite well by Fig. 1 which shows that the discrepancies are about -5% for strong transitions with a strength on the order of 10-19cm-1/(molecule cm-2).
-In the spectral range 9500 – 14500 cm-1, line positions and intensities were taken from Tolchenov and Tennyson [4]. These data, representing 12,027 entries, came from a refit of room temperature Fourier Transform absorption spectra of pure, natural abundance, water vapor due to Schermaul et al. [5-6] recorded at path-lengths from 5 up to 800 m. These parameters have been demonstrated [4] to give a more consistent representation of the underlying spectrum than previous studies.
-In this spectral region, calculations of H2O rotation-vibration line broadening and shifting due to N2 and O2 pressure effects are performed using a semi-empirical approach which is based on impact theory modified by introducing additional parameters to extend the use of empirical data [7]. This method was further developed by using anharmonic wavefunctions in the estimates of the line parameters. The main feature is the use of a complete set of high accuracy vibration-rotation dipole transition moments calculated for all possible transitions using wavefunctions determined from variational nuclear motion calculations and an ab initio dipole moment surface [8]. Full details of this approach are described in Ref. [9]. The results of H2O line parameters calculation and comparison with experimental data are presented in Ref. [10-12].
-Figure 2 distinguishes between H2O lines in the frequency range 9500-14500 cm-1, presented in the version GEISA 2003 and added in the last version.
Practically, the resulting total file for GEISA update has been processed as the following: as a first step the Toth’s data were retained and replaced, for the main H216O isotopic species, by the Coudert’s ones of similar quantum identification; as a second step the file was finalized by adding the new data of the 9500-14500 cm-1 spectral region. The GEISA 2011 H2O archive comprises 67,876 entries against 58,726 in GEISA 2003.
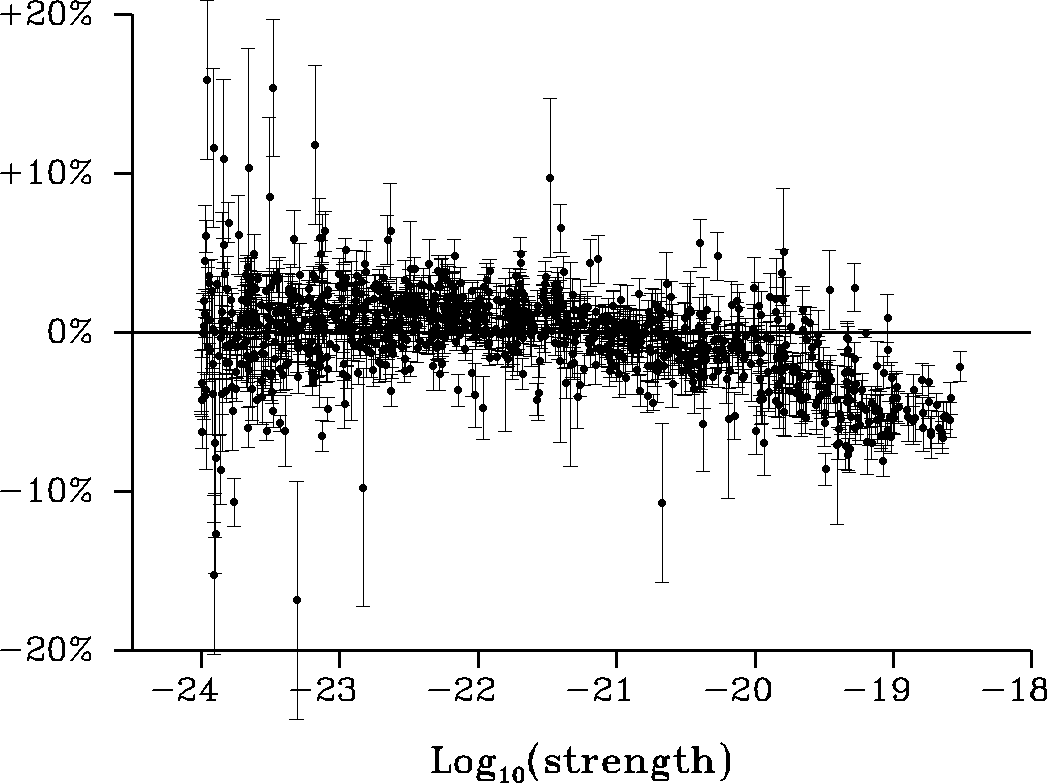
Figure 1. For transitions measured in Ref. [3], this figure shows the observed minus calculated line strength residuals, in percent of the observed line strength, obtained with the line strengths calculated in this work. The abscissa is the base 10 logarithm of the observed line strength in cm-1/(molecule cm-2). Each data point is indicated by a dot, error bars are also drawn. For clarity purpose the figure only displays the 967 stronger transitions from Ref. [3], belonging to the ν2 band, with a strength larger than 10-24 cm-1/(molecule cm-2).
Figure 2. Transition intensity against wavenumber for presented in GEISA 2003 transitions (Δ) and added in GEISA 2011 transitions (+).
References
[1] Coudert LH, Wagner G, Birk M, Baranov YuI, Lafferty WJ and Flaud J-M.TheH216O molecule:linepositionandlineintensityanalysesuptothesecond triad. J MolSpectrosc 2008;251:339-57.
[2]Lanquetin R, Coudert LH, Camy-Peyret C. High-lying rotational levels of water: an analysis of the energy levels of the five first vibrational states. J Mol Spec 2001;206:83-103.
[3] Toth RA. Water vapor measurements between 590 and 2582 cm-1 : line positions and strengths. J Mol Spectrosc 1998;190:379-96.
[4] Tolchenov RN and Tennyson J. Water line parameters from refitted spectra constrained by empirical upper state levels: study of the 9500 – 14500 cm-1 region. JQSRT 2008;109:559-68.
[5] Schermaul R, Learner RCM, Newnham DA, Williams RG, Ballard J, Zobov NF, Belmiloud D and Tennyson J. The water vapour spectrum in the region 8600-15000 cm-1: experimental and theoretical studies for a new spectral line database I: Laboratory measurements. J Mol Spectrosc 2001;208:32-42.
[6] Schermaul R, Brault JW, Canas AAD, Learner RCM, Polyansky OL, Zobov NF, Belmiloud D and J. Tennyson J. Weak line water vapour spectrum in the regions 13,200 – 15,000 cm-1. J Mol Spectrosc 2002;211:169-78.
[7] Bykov A, Lavrentieva N and Sinitsa L. Semi-empiric approach for the line broadening and shifting calculation. Mol Phys 2004;102:1706-712.
[8] Barber RJ, Tennyson J, Harris GJ and Tolchenov RN. A high accuracy computed water line list. Mon Not R Astr Soc 2006;368:1087-94.
[9] Bykov AD, Lavrentieva NN, Mishina TP, Sinitsa LN, Barber RJ, Tolchenov RN, Tennyson J. Water vapor line width and shift calculations with accurate vibration-rotation wave functions. JQSRT 2008;109:1834-44.
[10] Hodges JT, Lisak D, Lavrentieva NN, Bykov A, Sinitsa L, Tennyson J, Barber RJ, Tolchenov RN. Comparison between theoretical calculations and high-resolution measurements of pressure broadening for near-infrared water spectra. J Mol Spectrosc 2008;249:86-94.
[11] Bykov AD, Lavrentieva NN, Petrova TM, Sinitsa LN, Solodov AM, Barber RJ, Tennyson J, Tolchenov RN. Shift of the centers of H2O absorption lines in the region of 1.06 µm. Optika i spectrosc 2008;105:25-31.
[12] Lavrentieva NN, Osipova A, Sinitsa L, Claveau Ch, Valentin A. Shifting temperature dependence of nitrogen-broadened lines in the ν2 band of H2O. Mol Phys 2008;106:1261-66.
Carbon dioxide, like water, is an ubiquitous species observed in most of the solar system planets. To accommodate planetary applications, a new GEISA 2011 linelist has been formed with over 420,000 transitions of seven isotopologues (12C16O2, 13C16O2, 16O12C18O, 16O12C17O, 16O13C18O, 16O13C17O and 12C18O2) isotopologues between 5.9 and 12784.0 cm-1. This increase in the number of transitions (from 76,826 to 421,124) compared to the GEISA 2003 list [1] arises from lowering the minimum intensity to 10-30 cm-1/(molecule cm-2) at 296 K and merging two compilations, the CDSD-296 databank [2] and JPL near-infrared linelist [3]. We note that only the isotopic species 13C18O2 and 16O12C18O have been retained from GEISA 2003 in the final GEISA 2011 CO2 line list.
The current version of the CDSD-296 databank is the extension and development of the previous version of Carbon Dioxide Spectroscopic Databank elaborated in 2003 [4] which was used in GEISA-IASI [5] and GEISA 2003 [1]. Compared to the previous version, three new isotopologues 16O13C18O, 16O13C17O and 12C18O2 are added to the new GEISA. For the four most abundant isotopologues 12C16O2, 13C16O2, 16O12C18O and 16O12C17O, the line positions and line intensities are calculated using new sets of effective Hamiltonian and effective dipole moment constants. These new constants are determined by including extensive new measurements in the fitting (see [6-30] and references therein); in particular, the data obtained at the Jet Propulsion Laboratory (Pasadena) and at the Joseph Fourier University (Grenoble) resulted in better accuracy and completeness for the near infrared calculations. Using Fourier Transform Spectroscopy experiments the first team has performed very precise measurements of both line positions and line intensities of nine isotopologues of carbon dioxide in the 4300-7000 cm-1 region [3,9,19,23,28]. The second team used high sensitive Cavity Ring Down Spectroscopy experiments and measured line positions and line intensities of number of lines including very weak lines (up to 10-29 cm-1/(molecule cm-2)) of several isotopologues in the 5851-7045 cm-1 region [6,11,17,22,26,27,29,30]. The parameters of these weak lines belonging to high J values or to hot bands allowed to improve considerably the extrapolation properties of elaborated models of effective Hamiltonian and effective dipole moment operators. The used theoretical approach for global modeling of high resolution spectra of carbon dioxide is presented in Refs. [31-34]. The extension of the wavenumber region for the rare isotopologues was done due to the utilization of the sets of the effective dipole moment parameters belonging to the most abundant isotopologues. In order to meet needs of the modern infrared sensors the intensity cutoff was lowered to 10-30 cm-1/(molecule cm-2) at 296 K. Because of this a large number of additional weak bands and weak lines corresponding to large values of the angular momentum quantum number of the strong bands appeared in the new version of CDSD-296. The accuracy of the line parameters of these weak lines strongly relies on the extrapolation abilities of the used models. It was shown in Ref. [35] that effective operator models, used for the generation of CDSD-296, provide the reliable extrapolation properties.
On average, the residuals between CDSD calculated line positions and those observed are two times larger than measurement uncertainties. The CDSD calculated line intensities are practically always within their measurement uncertainties for the most abundant isotopologues. Air- and self-broadening parameters were calculated using the equations from Rothman et al. [36], but the air-shifting parameter was set to zero throughout. The current atmospheric version of the databank is available on the site of the Institute of Atmospheric Optics: ftp.iao.ru/pub/CDSD-2008/296.
At the end, it was determined that some of the intensities in the near infrared linelist from Toth et al. were more accurate than the reanalyzed values and that the newer pressure broadening coefficients (widths and shifts) in the Toth’s et al. studies [37,38] better represented the measured spectra. Therefore, this linelist, of initially 28,530 entries, has been retained for GEISA 2011 update too, adopting the following process for its inclusion: first, were discarded 15,788 lines the intensities of which were lower of 10-26 cm-1/(molecule cm-2) at 296 K for the two main isotopologues 12C16O2 and 13C16O2 and for all the isotopologues with intensities expressed in 10-29 and 10-30 cm-1/(molecule cm-2) at 296 K (L.R. Brown private communication); second, the 12,742 remaining lines were merged with the CDSD ones, replacing them when the quantum identification was similar.
With this change the Toth et al. choice of γair, γself and δ parameters [37,38] are included in GEISA 2011. These broadening parameters were replaced, for 12C16O2 lines of similar quantum identification, by the ones resulting from newer work of Predoi-Cross et al [39,40] for temperature dependence of air-broadened CO2 widths, temperature dependence of air pressure shift and temperature dependence of the self broadening half-width,. The Predoi-Cross et al. parameters were implemented in the whole of the line list when available. Finally, since the databases have been formed, a new effort to predict air-broadened pressure shifts has been done by Hartmann [41] which should be considered for future revisions.
References
[1] Jacquinet–Husson N, Scott NA, Chédin A, Crépeau L, Armante R, Capelle V, Orphal J, Coustenis A, Boonne C, Poulet–Crovisier N, Barbe A, Birk M, Brown LR, Camy–Peyret C, Claveau C, Chance K, Christidis N, Clerbaux C, Coheur PF, Dana V, Daumont L, De Backer–Barilly M, Di Lonardo G, Flaud JM, Goldman A, Hamdouni A, Hess M, Hurley MD, Jacquemart D, Kleiner I, Köpke P, Mandin J-Y, Massie S, Mikhailenko S, Nemtchinov V, Nikitin A, Newnham D, Perrin A, Perevalov VI, Pinnock S, Régalia–Jarlot L, Rinsland CP, Rublev A, Schreier F, Schult L, Smith KM, Tashkun SA, Teffo JL, Toth RA, Tyuterev VlG, Vander Auwera J, Varanasi P and Wagner G. The GEISA spectroscopic database: Current and future archive for Earth and planetary atmosphere studies. JQSRT 2008;109:1043-59.
[2] Perevalov VI, Tashkun SA. CDSD-296 (Carbon Dioxide Spectroscopic Databank): Updated and Enlarged Version for Atmospheric Applications. 10th HITRAN Database Conference, Cambridge MA, USA, 2008. ftp.iao.ru/pub/CDSD-2008/296
[3] Toth RA, Brown LR, Miller CE, Devi VM, Benner DC, Miller CE. Spectroscopic database of CO2 line parameters: 4300-7000 cm-1, JQSRT 2008;109, 906-21.
[4] Tashkun SA, Perevalov VI, Teffo JL, Bykov AD, Lavrentieva NN. CDSD-296, the carbon dioxide spectroscopic databank: version for atmospheric applications. In: XIV symposium on high resolution molecular spectroscopy, Krasnoyarsk, Russia, July 6-11, 2003.
[5] Jacquinet-Husson N, Scott NA, Chédin A, Garceran K, Armante R, Chursin AA, Barbe A., Birk M, Brown LR, Camy-Peyret C, Claveau C, Clerbaux C, Coheur PF, Dana V, Daumont L, Debacker-Barilly MR, Flaud JM, Goldman A, Hamdouni A, Hess M, Jacquemart D, Köpke P, Mandin J-Y, Massie S, Mikhailenko S, Nemtchinov V, Nikitin A, Newnham D, Perrin A, Perevalov VI, Régalia-Jarlot L, Rublev A, Schreier F, Schult L, Smith KM, Tashkun SA, Teffo JL, Toth RA, Tyuterev VlG, Vander Auwera J, Varanasi P, Wagner G. The 2003 edition of the GEISA/IASI spectroscopic database. JQSRT 2005;95:429-67.
[6] Ding Y, Macko P, Romanini D, Perevalov VI, Tashkun SA, Teffo JL, Hu SM, Campargue A. High sensitivity cw-cavity ringdown and Fourier transform absorption spectroscopies of 13CO2. J Mol Spectrosc 2004;226:146-60.
[7] André F, Perrin MY, Taine J. FTIR measurements of 12C16O2 line positions and intensities at high temperature in the 3700-3750 cm-1 spectral region. J Mol Spectrosc 2004;228:187-205.
[8] Amy-Klein A, Vigué H, Chardonnet C. Absolute frequency measurement of 12C16O2 laser lines with a femtosecond laser comb and new determination of the 12C16O2 molecular constants and frequency grid. J Mol Spectrosc 2004;228:206-12.
[9] Miller CE, Montgomery MA, Onorato RM, Johnstone C, McNicholas TP, Kovaric B, Brown L.R. Near infrared spectroscopy of carbon dioxide. II : 13C16O2 and 16O13C18O line positions. J Mol Spectrosc 2004;228:355-74.
[10] Pouchet I, Zéninari V, Parvitte B, Durry G. Diode laser spectroscopy of CO2 in the 1.6 µm region for the in situ sensing of the middle atmosphere. JQSRT 2004;83:619-28.
[11] Majcherova Z, Macko P, Romanini D, Perevalov VI, Tashkun SA, Teffo JL, Campargue A. High-sensitivity CW-cavity ringdown spectroscopy of 12CO2 near 1.5 µm. J Mol Spectrosc 2005;230:1-21.
[12] Ding Y, Campargue A, Bertseva E, Tashkun S, Perevalov VI. Highly sensitive absorption spectroscopy of carbon dioxide by ICLAS-VeCSEL between 8800 and 9530 cm-1. J Mol Spectrosc 2005;231:117-23.
[13] Wang L, Perevalov VI, Tashkun SA, Liu AW, Hu SM. Absorption spectra of 12C16O2 and 13C16O2 near 1.05 µm. J Mol Spectrosc 2005;233:297-300.
[14] Wang L, Perevalov VI, Tashkun SA, Ding Y, Hu SM. Absolute line intensities of 13C16O2 in the 4200-8500 cm-1 region. J Mol Spectrosc 2005;234:84-92.
[15] Vander Auwera J, Claveau C, Teffo JL, Tashkun SA, Perevalov VI. Absolute line intensities of 13C16O2 in the 3090-3920 cm-1 region. J Mol Spectrosc 2006;235:77-83.
[16] Boudjaadar D, Mandin JY, Dana V, Picqué N, Guelachvili G. 12C16 line intensity measurements around 1.6 µm . J Mol Spectrosc 2006;236:158-67.
[17] Perevalov BV, Kassi S, Romanini D, Perevalov VI, Tashkun SA, Campargue A. CW-cavity ringdown spectroscopy of carbon dioxide isotopologues near 1.5 µm. J Mol Spectrosc 2006;238:241-55.
[18] Tanaka T, Fukabori M, Sugita T, Nakajima H, Yokota T, Watanabe T, Sasano Y. Spectral line parameters for CO2 bands in the 4.8 to 5.3 µm region. J Mol Spectrosc 2006;239:1-10.
[19] Toth RA, Brown LR, Miller CE, Devi VM, Benner DC. Line strengths of 12C16O2: 4550-7000 cm-1. J Mol Spectrosc 2006;239:221-42.
[20] Le Barbu T, Zéninari V, Parvitte B, Courtois D, Durry G. Line strengths and self-broadening coefficients of carbon dioxide isotopologues (13CO2 and 18O12C16O) near 2.04 µm for the in situ laser sensing of the Martian atmosphere. JQSRT 2006;98:264-76.
[21] Régalia-Jarlot L, Zéninari V, Parvitte B, Grossel A, Thomas X, von der Heyden P, Durry G. A complete study of the line intensities of four bands of CO2 around 1.6 and 2.0 µm: A comparison between Fourier transform and diode laser measurements. JQSRT 2006;101:325-38.
[22] Perevalov BV, Kassi S, Romanini D, Perevalov VI, Tashkun SA, Campargue A. Global effective Hamiltonians of 16O13C17O and 16O13C18O improved from CW-CRDS observations in the 5900-7000 cm-1 region. J Mol Spectrosc 2007;241:90-100.
[23] Toth RA, Miller CE, Brown LR, Devi VM, Benner DC. Line positions and strengths of 16O12C18O, 18O12C18O and 17O12C18O between 2200 and 7000 cm-1. J Mol Spectrosc 2007;243:43-61.
[24] Wang L, Perevalov VI, Tashkun SA, Song KF, Hu SM. Fourier Transform spectroscopy of 12C18O2and 16O12C18O in the 3800-8500 cm-1 region and the global modeling of the absorption spectrum of 12C18O2. J Mol Spectrosc 2008;247:64-85.
[25] Wilquet V, Mahieux A, Vandaele AC, Perevalov VI, Tashkun SA, Fedorova A, Korablev O, Montmessin F, Bertaux JL. Line parameters for the 01111-00001 band of 12C16O18O from SOIR measurements of the Venus atmosphere. JQSRT 2008;109:895-905.
[26] Perevalov BV, Deleporte T, Liu AW, Kassi S, Campargue A, Vander Auwera J, Tashkun SA, Perevalov VI. Global modeling of 13C16O2 absolute line intensities from CW-CRDS and FTS measurements in the 1.6 and 2.0 micrometer regions. JQSRT 2008;109:2009-26.
[27] Perevalov BV, Kassi S, Perevalov VI, Tashkun SA, Campargue A. High sensitivity CW-CRDS spectroscopy of 12C16O2, 16O12C17O and 16O12C18O between 5851 and 7045 cm-1: line positions analysis and critical review of the current databases. J Mol Spectrosc 2008;252:143-59.
[28] Toth RA, Miller CE, Brown LR, Devi VM, Benner DC. Line strengths of 16O13C16O, 16O13C18O, 16O13C17O and 17O13C18O between 2200 and 6800 cm-1. J Mol Spectrosc 2008;251:64-89.
[29] Perevalov BV, Campargue A, Gao B, Kassi S, Tashkun SA, Perevalov VI. New CW-CRDS measurements and global modeling of 12C16O2 absolute line intensities in the 1.6 µm region. J Mol Spectrosc 2008;252:190-7.
[30] Perevalov BV, Perevalov VI, Campargue A. A (nearly) complete experimental line list for 13C16O2,16O13C18O, 16O13C17O, 13C18O2 and 17O13C18O by high-sensitivity CW-CRDS spectroscopy between 5851 and 7045 cm-1. JQSRT 2008;109:2437-62.
[31] Teffo JL, Sulakshina ON, Perevalov VI. Effective Hamiltonian for rovibrational energies and line intensities of carbon dioxide. J Mol Spectrosc. 1992;156:48-64.
[32] Perevalov VI, Lobodenko EI, Lyulin OM, Teffo JL. Effective dipole moment and band intensities problem for carbon dioxide. J Mol Spectrosc. 1995;171:435-52.
[33] Tashkun SA, Perevalov VI, Teffo JL, Rothman LS, Tyuterev VG. Global fitting of 12C16O2 vibration-rotation line positions using the effective Hamiltonian approach. JQSRT 1998;60:785-801.
[34] Tashkun SA, Perevalov VI, Teffo JL, Tyuterev VG. Global fit of 12C16O2 vibration-rotation line intensities using the effective operator approach. JQSRT 1999;62:571-98.
[35] Campargue A, Perevalov BV. Comment on ‘Spectroscopic database of CO2 line parameters: 4300-7000 cm-1‘. JQSRT 2008;109:2261-71.
[36] Rothman LS, Hawkins RL, Wattson RB, Gamache RR. Energy levels, intensities, and linewidths of atmospheric carbon dioxide bands. JQSRT 1992;48:537-66.
[37] Toth RA, Miller CE, Devi VM, Benner DC, Brown LR. Air-broadened width and pressure shift coefficients of 12C16O2: 4700-7000 cm-1. J Mol Spectrosc 2007;246:133-57.
[38] Toth RA, Brown LR, Miller CE, Devi VM, Benner DC, Dulick M. Self-broadened widths and shifts of CO2, J Mol Spectrosc 2006;239:243-71.
[39] Predoi-Cross A, McKellar ARW, Benner DC, Devi VM, Gamache RR, Miller CE, Toth RA, Brown LR. Temperature dependences for air-broadened Lorentz half width and pressure-shift coefficients in the 30013←00001 and 30012←00001 bands of CO2 near 1600 nm, Can J Phys 2009;87:517-35.
[40] Rothman Rothman LS, Gordon IE, Barbe A, Chris Benner D, Bernath PF, Birk M, Boudon V, Brown LR, Campargue A, Champion J-P, Chance K, Coudert LH, Dana V, Devi VM, Fally S, Flaud J-M, Gamache RR, Goldman A, Jacquemart D, Kleiner I, Lacome N, Lafferty WJ, Mandin J-Y, Massie ST, Mikhailenko SN, Miller CE, Moazzen-Ahmadi N, Naumenko OV, Nikitin AV, Orphal J, Perevalov VI, Perrin A, Predoi-Cross A, Rinsland CP, Rotger M, Simeckova M, Smith MAH, Sung K, Tashkun SA, Tennyson J, Toth RA, Vandaele AC, VanderAuwera J. The HITRAN 2008 molecular spectroscopic database. JQSRT 2009;110:533-72.
[41] Hartmann JM, A simple empirical model for the collisional spectral shift of air-broadened CO2 lines, JQSRT, doi:10.1016/j.jqsrt.2009.05.016 (in press)
An update of the line positions and intensities has been made for the first three isotopologues of ozone, 16O3, 16O16O18O, and 16O18O16O.
For the main isotope 16O3, the list of the 27 newly included bands in GEISA is given in the first column of Table 1 with associated spectral interval (cm-1), number of lines and sum of line intensities (expressed in 10-22 cm/molecule-1), in columns 2 to 3 respectively. Table 2 lists the 28 updated bands with a similar display. These data cover the spectral range from 1613 to 4845 cm-1. The line list is given with a cut-off of 2×10-26 cm molecule-1 at 296 K for 100% of 16O3 abundance. These results are based on the analyses of the absorption spectra recorded by the GSMA laboratory using the Fourier Transform Spectrometer of the Champagne-Ardenne University (Reims, France) [1].
The calculations of the line positions were made by using Hamiltonian parameters for the lower states from Ref. [2] for the (000), (100) and (001) states, from Ref. [3] for the (010) state, from Ref. [4] for the (020) state. The line positions of three bands associated with the (031) upper state (3ν2+ν3-2ν2, 3ν2+ν3-ν2, and 3ν2+ν3) have been calculated using Hamiltonian parameters of Ref. [5]. The transition moment parameters of the ν2+ν3 band [6] were used for calculation of line intensities for the 3ν2+ν3-2ν2 band. The line intensities of two others bands were calculated with the transition moment parameters of Ref. [5]. The line positions of six bands associated with the upper states (022) and (121) have been calculated using Hamiltonian parameters for the upper states [7]. The calculations of the line intensities of the 2ν2+2ν3 and ν1+2ν2+ν3, 2ν2+2ν3-ν2 and ν1+2ν2+ν3-ν2, 2ν2+2ν3-2ν2 and ν1+2ν2+ν3-2ν2 bands were made with the transition moment parameters [7,8, and 9] respectively. The line positions of four bands of Table 1 and of all bands of Table 2 (except the band ν1+2ν2+ν3-ν2) associated with the upper states {(012), (111), (210), (003), (102), (201), (130), (300)} have been calculated using Hamiltonian parameters for the upper states from Ref. [10]. The transition moment parameters for the cold bands (2590-3400 cm-1 spectral range) of these states are given in Ref. [10]. The calculations of the main part of the hot bands line intensities have been done with the transition moments of Refs. [6,9,11]. The dipole moment transitions of the 2<ν1+ν3-ν2, ν1+2ν3-ν2 and 3ν3-ν1 bands can be found at the web site of the S&MPO system [http://smpo.iao.ru/ru/tran/par/1/8-2/ ; http://smpo.iao.ru/ru/tran/par/1/8-3/]. Three bands of the (131) upper state have been calculated with the Hamiltonian parameters [14] and the transition moment parameters [12] and [7, 11] for the cold and hot bands respectively. The line positions of the eight bands associated with the upper states {(014), (113), (320)} and the line intensities of cold bands have been calculated using Hamiltonian and transition moments parameters of Ref. [13]. For the calculations of the line intensities of the ν1+ν2+3ν3-ν1, ν2+4ν3-ν3, and ν1+ν2+3ν3-ν2 hot bands, the transition moment parameters from Refs. [14] and [15] respectively were used. The estimations of the transitions moments of the 4ν3 and 3ν1+ν2 bands [16] have been used for the calculations of the lines intensities of the ν2+4ν3-ν2, and 3ν1+2ν2-ν2 hot bands. The 2ν1+2ν3, 3ν1+ν3, 2ν1+2ν2+ν3 and 2ν1+ν2+2ν3 bands calculations are based on the results of Refs. [17-20].
Table 3 lists 9 new bands in the 5935-6394 cm-1 spectral region. These results were obtained by using CW-CRDS technique [21,22]. The spectra have been recorded in Laboratoire de Spectrométrie Physique of the Joseph Fourier University (Grenoble, France). The analysis and theoretical modelling of these data have been reported in Refs. [22,23]. Note, two bands of this data set leading in the 6017-6131 and 6318-6394 cm-1 ranges are labeled as 2ν1+2ν2+2ν3 band. See Refs. [22,23] for more details.
The spectral interval 1854-2768 cm-1 has been updated for each of the two isotopologues 16O16O18O and 16O18O16O, related with bands: 2ν3, ν1+ν2+ν3-ν2, ν1+ν3, 2ν1, ν1+ν2+ν3. Bands 2ν3, ν1+ν2+ν3–ν2, 2ν1, ν1+ν2+ν3 of 16O16O18O as well as bands ν1+ ν2+ ν3 and ν1+ ν2+ ν3–ν2 of 16O18O16O have been included in the GEISA databank for the first time. The calculations of all bands of both molecules were made using Hamiltonian parameters for the lower states from Ref. [24] for the (000) and (010) states. Hamiltonian parameters of the upper vibrational states correspond to Ref. [25] for 16O16O18O and to Ref. [28] for 16O18O16O. The transition moment parameters of both species, given by A. Barbe and M.-R. De Backer-Barilly [27], have been obtained from the studies of Fourier-transform ozone spectra enriched by oxygen-18. Line lists are given with a cut-off of 1×10-24 molecule cm-1 at 296 K for 100% of 16O16O18O and 16O18O16O abundance respectively.
References
[1] Plateaux JJ, Barbe A, Delahaigue A. Reims high resolution Fourier transform spectrometer. Data reduction for ozone. Spectrochimica Acta. Part A 1995;51:1153-69.
[2] Flaud J-M, Camy-Peyret C, Malathy Devi V, Rinsland CP, Smith MAH. The ν1 and ν3 bands of 16O3: Line positions and intensities. J Mol Spectrosc 1987;124:209-17.
[3] Flaud J-M, Camy-Peyret C, Rinsland CP, Smith MAH, Malathy Devi V. Line parameters for 16O3 bands in the 7-µm region. J Mol Spectrosc 1989;134:106-12.
[4] Mikhailenko S. Private communication (June 2000); http://smpo.iao.ru/en/lev/par/1/4/
[5] Barbe A, Mikhailenko SN, Plateaux J-J, Tyuterev VlG. First study of the v2=3 dyad {(130), (031)} of ozone through the analysis of hot bands in the 2300-2600 cm-1 region. J Mol Spectrosc 1998;187:70-4.
[6] Malathy Devi V, Flaud J-M, Camy-Peyret C, Rinsland CP, Smith MAH. Line positions and intensities for the ν1+ν2 and ν2+ν3 bands of 16O3. J Mol Spectrosc 1987;125:174-83.
[7] Bouazza S, Barbe A, Mikhailenko SN, Plateaux J-J. Line positions and intensities of the ν1+2ν2+ν3 and 2ν2+2ν3 bands of 16O3. J Mol Spectrosc 1994;166:365-71.
[8] Mikhailenko SN, Barbe A, Plateaux J-J, Tyuterev VlG. New analysis of 2ν1+ν2, ν1+ν2+ν3, and ν2+2ν3 bands of ozone in the 2600-2900 cm-1 region. J Mol Spectrosc 1999;196:93-101.
[9] Barbe A, Plateaux J-J, Bouazza S, Sulakshina ON, Mikhailenko SN, Tyuterev VlG, Tashkun SA. Experimental and theoretical study of absolute intensities of ozone spectral lines in the range 1850-2300 cm-1 JQSRT 1994;52:341-55.
[10] Mikhailenko S, Barbe A, Tyuterev VlG. Extended analysis of line positions and intensities of ozone bands in the 2900-3400 cm-1 region. J Mol Spectrosc 2002;215:29-41.
[11] Barbe A, Sulakshina ON, Plateaux J-J, Hamdouni A, Bouazza S. High-resolution infrared spectra of ozone in the 2300-2600 cm-1 region. J Mol Spectrosc 1995;170:244-50. http://smpo.iao.ru/ru/tran/par/1/8-2/ http://smpo.iao.ru/ru/tran/par/1/8-3/
[12] Barbe A, Mikhailenko SN, Plateaux J-J. First observation of the v2=3 state of ozone: The (131) state through analysis of cold and hot bands. Study of v2 behavior. J Mol Spectrosc 1997;184:448-53.
[13] Mikhailenko S, Barbe A, Tyuterev VlG, Régalia L, Plateaux J-J. Line positions and intensities of the ν1+ν2+3ν3, ν2+4ν3, and 3ν1+2ν2 bands of ozone. J Mol Spectrosc 1996;180:227-35.
[14] Bouazza S, Mikhailenko SN, Barbe A, Régalia L, Tyuterev VlG, Plateaux J-J. The ν1+ν2+2ν3 and ν2+3ν3 bands of 16O3. J Mol Spectrosc 1995;174:510-19.
[15] Perrin A, Vasserot AM, Flaud J-M, Camy-Peyret C, Malathy Devi V, Smith MAH, Rinsland CP, Barbe A, Bouazza S, Plateaux J-J. The 2.5-µm bands of ozone: Line positions and intensities. J Mol Spectrosc 1991;149:519-29.
[16] Mikhailenko S, Barbe A, Tyuterev VlG, Plateaux J-J. New analysis of the (211)/(140)/(310)/(004)/(103) interacting states of ozone. VIII Joint International Symposium “Atmospheric and Ocean Optics, Atmospheric physics” June 25-29, 2001, Irkutsk.
[17] Barbe A, Plateaux J-J. Analysis of the 2ν1+2ν3 band of ozone: Line positions and intensities. JQSRT 1996;55:449-55.
[18] Barbe A, Sulakshina ON, Plateaux J-J, Tyuterev VlG, Bouazza S. Line positions and intensities of the 3ν1+ν3 band of ozone. J Mol Spectrosc 1996;175:296-302.
[19] Barbe A, Mikhailenko SN, Tyuterev VlG, Hamdouni A, Plateaux J-J. Analysis of the 2ν1+2ν2+ν3 band of ozone.J Mol Spectrosc 1995;171:583-88.
[20] Barbe A, Mikhailenko SN, Plateaux J-J, Tyuterev VlG. Analysis of the 2ν1+ν2+2ν3 band of ozone. J Mol Spectrosc 1997;182:333-41.
[21] Morville J, Romanini D, Kachanov AA, Chenevier M. Two schemes for trace detection using cavity ringdown spectroscopy. Appl Phys 2004;B78:465-76.
[22] De Backer-Barilly MR, Barbe A, Tyuterev VlG, Romanini D, Moeskops B, Campargue A. Fourier Transform and high sensitivity CW-cavity ring down absorption spectroscopies of ozone in the 6030 – 6130 cm-1 region. First observation and analysis of the 3ν1+3ν3 and 2ν2+5ν3 bands. J Mol Structure 2006;780-1:225-33.
[23] Barbe A, De Backer-Barilly M-R, Tyuterev VlG, Campargue A, Romanini D, Kassi S. CW-cavity ring down spectroscopy of the ozone molecule in the 5980 – 6220 cm-1 region. J Mol Spectrosc 2007;242:156-75.
[24] Flaud J-M, Camy-Peyret C, N’Gom A, Malathy Devi V, Rinsland CP, Smith MAH. The ν2 bands of 16O18O16O and 16O16O18O: Line positions and intensities. J Mol Spectrosc 1989;133:217-23.
[25] Chichery A, Barbe A, Tyuterev VlG, Tashkun SA. High resolution IR spectra of 18O-enriched ozone: Band centers of 16O16O18O, 16O18O18O, 18O16O18O, and 16O18O16O. J Mol Spectrosc 2001;205:347-49.
[26] De Backer-Barilly MR, Barbe A, Tyuterev VlG, Chichery A, Bourgeois M-T. High-resolution infrared spectra of the 16O18O16O ozone isotopomer in the range 900-5000 cm-1: Line positions. J Mol Spectrosc 2002;216:454-64.
[27] Barbe A and De Backer-Barilly M-R. Private communication (2007)
Table 1. New ozone bands (16O3) in the current edition of GEISA
|
Band |
Spectral region (cm-1) |
Number of lines |
SV(10-22 cm/mol) |
|
031 – 020 |
1632 – 1711 |
1109 |
1.747 |
|
022 – 020 |
1921 – 2067 |
1046 |
.740 |
|
121 – 020 |
1984 – 2079 |
1817 |
14.342 |
|
130 – 001 |
1991 – 2061 |
3 |
.005 |
|
130 – 100 |
2040 – 2102 |
10 |
.026 |
|
201 – 010 |
2281 – 2325 |
11 |
.004 |
|
031 – 010 |
2333 – 2407 |
742 |
.477 |
|
022 – 010 |
2603 – 2769 |
1629 |
1.740 |
|
131 – 020 |
2666 – 2741 |
899 |
.834 |
|
031 – 000 |
3032 – 3111 |
689 |
.420 |
|
130 – 000 |
3133 – 3249 |
384 |
.126 |
|
022 – 000 |
3256 – 3511 |
1826 |
1.234 |
|
121 – 000 |
3286 – 3480 |
1764 |
7.481 |
|
131 – 010 |
3369 – 3440 |
910 |
.694 |
|
113 – 100 |
3506 – 3566 |
466 |
.197 |
|
014 – 001 |
3525 – 3605 |
992 |
1.316 |
|
113 – 010 |
3864 – 3968 |
1466 |
4.398 |
|
014 – 010 |
3875 – 3968 |
183 |
.076 |
|
320 – 010 |
3888 – 4000 |
279 |
.175 |
|
202 – 000 |
4034 – 4207 |
1387 |
1.108 |
|
131 – 000 |
4065 – 4145 |
714 |
.460 |
|
301 – 000 |
4179 – 4264 |
1213 |
2.489 |
|
221 – 000 |
4444 – 4525 |
1066 |
1.041 |
|
014 – 000 |
4522 – 4700 |
1998 |
1.638 |
|
113 – 000 |
4562 – 4668 |
1599 |
8.814 |
|
320 – 000 |
4586 – 4700 |
587 |
.435 |
|
212 – 000 |
4700 – 4845 |
924 |
.415 |
Table 2. Updated ozone bands (16O3) in the current edition of GEISA
|
Band |
Spectral region (cm-1) |
Number of lines |
SV (10-21 cm/mol) |
|
111 – 100 |
1613 – 1849 |
1271 |
.269 |
|
012 – 001 |
1616 – 1826 |
1581 |
.645 |
|
111 – 001 |
1629 – 1854 |
1557 |
.131 |
|
012 – 100 |
1637 – 1706 |
85 |
.004 |
|
210 – 100 |
1701 – 2051 |
1663 |
.198 |
|
210 – 001 |
1719 – 2066 |
388 |
.015 |
|
003 – 100 |
1848 – 2104 |
1920 |
1.183 |
|
003 – 001 |
1867 – 2098 |
2847 |
1.313 |
|
102 – 100 |
1869 – 2071 |
2206 |
.429 |
|
012 – 010 |
1872 – 2120 |
3794 |
3.221 |
|
201 – 100 |
1888 – 2243 |
2831 |
10.979 |
|
201 – 001 |
1896 – 2289 |
2165 |
.331 |
|
102 – 001 |
1901 – 2086 |
2965 |
15.787 |
|
111 – 010 |
1918 – 2220 |
3520 |
43.121 |
|
210 – 010 |
2005 – 2353 |
3050 |
.844 |
|
300 – 001 |
2012 – 2313 |
1804 |
.921 |
|
300 – 100 |
2021 – 2288 |
2508 |
.475 |
|
003 – 010 |
2254 – 2396 |
1809 |
1.199 |
|
102 – 010 |
2270 – 2407 |
479 |
.040 |
|
130 – 010 |
2424 – 2552 |
487 |
.019 |
|
012 – 000 |
2590 – 3025 |
3886 |
3.293 |
|
111 – 000 |
2626 – 3050 |
3604 |
25.087 |
|
121 – 010 |
2678 – 2774 |
1851 |
1.658 |
|
210 – 000 |
2704 – 3156 |
3327 |
.812 |
|
003 – 000 |
2907 – 3202 |
4512 |
141.143 |
|
201 – 000 |
2919 – 3273 |
2706 |
7.910 |
|
102 – 000 |
2925 – 3196 |
4646 |
12.774 |
|
300 – 000 |
2955 – 3398 |
2445 |
.472 |
Table 3. New ozone bands (16O3) from CW-CRDS spectra
|
Band |
Spectral region (cm-1) |
Number of lines |
SV (10-24 cm/mol) |
|
034 – 000 |
5935 – 6083 |
610 |
1.178 |
|
105 – 000 |
5971 – 6071 |
1006 |
2.456 |
|
124 – 000 |
6004 – 6363 |
1933 |
4.566 |
|
223I – 000 |
6017 – 6131 |
1578 |
13.188 |
|
510 – 000 |
6030 – 6139 |
272 |
.401 |
|
025 – 000 |
6225 – 6311 |
913 |
7.656 |
|
430 – 000 |
6295 – 6395 |
75 |
.298 |
|
501 – 000 |
6301 – 6366 |
685 |
6.335 |
|
223II – 000 |
6318 – 6394 |
717 |
6.758 |
The N2O line list has been almost completely revised. Only the rotational part: 0.83 – 45.263 cm-1 has been kept from GEISA 2003. The whole of the 50,182 lines of the Toth’s data from: http://mark4sun.jpl.nasa.gov/n2o.html, in the spectral range 525.462272 – 7796.633112 cm-1, has been included in GEISA 2011. This has represented an increase of 23,952 N2O lines in GEISA 2003 and the addition of three newly archived isotopologues, i.e.: 15N216O, 14N15N18O, 15N14N18O. The N2O GEISA 2011 archive comprises now a total of 50,633 entries and eight isotopologues.
References
[1] Toth RA. Linelist of N2O. parameters from 500 to 7500 cm-1; http://mark4sun.jpl.nasa.gov/n2o.html and Refs therein.
[2] Toth RA. Line strengths (900-3600 cm-1) self-broadened linewidths and frequency shifts (1800-2660 cm-1) of N2O. Appl Opt 1993;32:7326-65.
[3] Toth RA. Line positions and strengths of N2O between 3515 and 7800 cm-1. J Mol Spectrosc 1999;197:158-87.
[4] Toth RA. N2O and air-broadened linewidths and frequency-shifts of N2O. JQSRT 2000;66:285-304.
CO (molecule 5)
No update for this molecule since the GEISA 2003 Edition
References
[1] Jacquinet-Husson N., Scott N.A., Chédin A., Garceran K., Armante R., Chursin A.A., Barbe A., Birk M., Brown L.R., Camy-Peyret C., Claveau C., Clerbaux C., Coheur P.F., Dana V., L. Daumont L., Debacker-Barilly M.R., Flaud J.M., Goldman A., Hamdouni A., Hess M., Jacquemart D., Köpke P., Mandin J-Y., Massie S., Mikhailenko S., Nemtchinov V., Nikitin A., Newnham D., Perrin A., Perevalov V.I., Régalia-Jarlot L., Rublev A., Schreier F., Schult L., Smith K.M., Tashkun S.A., Teffo J.L., Toth R.A., Tyuterev Vl.G., Vander Auwera J., Varanasi P., Wagner G. The 2003 edition of the GEISA/IASI spectroscopic database. JQSRT 2005;95:429-67.
[2] Jacquinet-Husson N, Scott N.A., Chédin A., Crépeau L., Armante R., Capelle V. et al. The GEISA spectroscopic database: Current and future archive for Earth and planetary atmosphere studies. JQSRT 2008;109:1043-59.
Author: L.R. Brown
Many of the infrared parameters of 12CH4 were updated between 0 and 3300 cm-1, but little changes was made in the 13CH4 parameters. At the longer wavelengths, a minimum intensity limit of 10-29 cm/molecule at 296 K was applied out of planetary considerations, but the weak lines were still not included in the near-IR regions. Misaligned fields in the near-IR quantum numbers were corrected, but only a few new assignments (and thus lower state energies) were entered to existing entries. Significant changes were made for air-broadening coefficients between 5800 and 6180 cm-1.
Below 3300 cm-1, new calculated 12CH4 line positions and intensities were obtained from the global analysis by Albert et al. [1] for the three lowest polyads (ground state, Dyad from 900 to 1900 cm-1 and Pentad from 1900 to 3400 cm-1). In the far-IR, the intensities of ground state – ground transitions were adjusted by 16% based on Wishnow et al. [2], but no change was required for the Dyad-Dyad (ν2–ν2, ν2–ν4, ν4-v4) hotbands. Some predicted Pentad (2ν4, ν2+ν4 ν-1, ν3 and 2ν2) positions were recomputed using semi-empirical upper state energy levels obtained by adding observed positions to calculated lower state energies. The hot band parameters between 900 to 3500 cm-1 and for the Octad (3200 to 4900 cm-1) were taken from GEISA 2003 rather than the global study because the prior database had better accuracies for the strongest features/in the interval; a minimum intensity limit for hot bands was set to 10-27 cm/molecule at 296 K.
The empirical line-list for methane near 6000 cm-1 was somewhat improved using new measurements of intensities, empirical lower state energies and broadening parameters of the stronger features. First, the intensities and widths for the 5860 to 6180 cm-1 region were replaced by results from Frankenberg et al. [3]. This also included implementation of the empirical lower state energies of Margolis [4,5] which were missing in GEISA 2003. In addition, lower state values from Gao et al. were added [6]. However, several thousand weak lines (< 10-24 cm/molecule at 296 K) are still missing between 5500 and 6180 cm-1. This is expected to improve when new work is released [7].
For broadening, relatively few (< 3000) direct measurements of widths and pressure shifts are available for methane transitions so that default values for self- and air- broadened widths, air-broadened shifts and temperature dependences are applied (similar to those used in older versions of GEISA [see 8,9]). For the 7.5 μm region of the Dyad, new measurements of ~ 500 transitions from Smith et al. [10] were inserted for self- and air-broadening widths, shifts and temperature dependence of widths. For the 3.3 μm region of the Pentad, ~ 3800 theoretically-predicted broadening coefficients (air-widths, pressure shifts and temperature dependences) from Antony et al. [11] and ~500 prior measurements [8] were inserted for ν3. At 2.3 μm (the Octad), the self- and air-broadening parameters of Predoi-Cross et al. [12,13] were retained in the list carried over from the GEISA 2003 database.
In the 1.66 μm region (the Tetradecad) over 480 hundred air-broadened widths and shifts and some temperature dependence were inserted between 5560 to 5860 cm-1 14], while the scaled N2-broadening reported by Frankenberg et al. [3] were used from 5860 to 6184 cm-1. Otherwise, defaults constants of 0.75 below 5860 cm-1 or 0.85 above 5860 cm-1 were set for the temperature dependence.
There are a number of ongoing and recent studies [7, 14-16] which will improve the near-IR parameters (4800 – 7700 cm-1) in the future. Lastly, the current methane database is customized to interpret atmospheric remote sensing of the Earth. Further near-IR analyses will be needed for planetary and stellar applications. (e.g. Thievin et al. [17]). Calculations of partition functions [18] and much weaker transitions can be found at http://www.iao.ru/mirs/mirs.htm or http://www.u-bourgogne.fr/LPUB/mirs.html. However, extrapolations to higher values of quanta provide less accurate parameters, particularly for the intensities.
References
[1] Albert S, Bauerecker A, Boudon V, Brown LR, Champion JP, Loëte M, Nikitin A, Quack M. Global Frequency and Intensity Analysis of 12CH4 in the 0-4800 cm-1 region. J Chem Phys, in press.
[2] Wishnow EH, Orton GS, Ozier I, Gush HP. The distortion dipole rotational spectrum of CH4: A low temperature far-infrared study. JQSRT 2007;103:102-17.
[3] Frankenberg C, Warneke T, Butz A, Aben I, Hase F, Spietz P, et al. Methane spectroscopy in the near infrared and its implication on atmospheric retrievals. Atmos Chem Phys. 2008;8:10021-55.
[4] Margolis JS. Measured line positions and strengths of methane between 5500 and 6180 cm-1. Appl Opt 1988;27:4038-51.
[5] Margolis JS. Empirical Values of the Ground State Energies for Methane Transitions Between 5500 to 6150 cm-1. Appl Opt 1990;29:2295-302.
[6]Gao B, Kassi S, Campargue A. Empirical low energy values for methane transitions in the 5852-6181 cm-1 region by absorption spectroscopy at 81 K. J Mol Spectrosc 2009;253:55-63.
[7] Perevalov VI, private communication on the GOSAT-IBUKI methane database.
[8] Brown LR, Benner DC, Champion JP, Devi VM, Fejard L, Gamache RR, et al. Methane line parameters in HITRAN. JQSRT 2003;82:219-38.
[9] Brown LR. Empirical line parameters of methane from 1.1 to 2.1 μm. JQSRT 2005;96:251-70.
[10] Smith MAH, Benner DC, Predoi-Cross A, Devi VM. Multispectrum analysis of 12CH4 in the μ4 band: I. Air-broadened half widths, pressure-induced shifts, temperature dependences and line mixing. 2009, JQSRT2009;110:639-53.
[11] Antony BK, Niles DL, Wroblewski SB, Humphrey CM, Gabard T, Gamache RR. N2-, O2– and air-broadened half-widths and line shifts for transitions in the μ3 band of methane in the 2726- to 3200-cm-1 spectral region. J Mol Spectrosc 2008;251:268-81.
[12] Predoi-Cross A, Brown LR, Devi VM, Brawley-Tremblay M, Benner DC. Multispectrum analysis of self-broadening and pressure-shifting coefficients of 12CH4 from 4100 to 4635 cm-1. J Mol Spectrosc 2005;232:231-46.
[13] Predoi-Cross A, Brawley-Tremblay M, Brown LR, Devi VM, Benner DC. Multispectrum analysis of 12CH4 from 4100 to 4635 cm-1: II. Air-broadening coefficients (widths and shifts). J Mol Spectrosc 2006;236:201-15.
[14] Lyulin OM, Nikitin AV, Perevalov VI, Morino I, Yokota T, Kumazawa R, Watanabe T, Measurements of N2– and O2-broadening and -shifting parameters of the methane spectral lines in the 5550-6236 cm-1 region. JQSRT 2009;110:654-68.
[15] Kassi S, Gao B, Romanini D, Campargue A. The near-infrared (1.30-1.70 μm) absorption spectrum of methane down to 77 K. Physical Chemistry Chemical Physics (Incorporating Faraday Transactions) 2008;10:4410.
[16] Nikitin AV, Mikhailenko S, Morino I, Yokota T, Kumazawa R, Watanabe T, Isotopic substitution shifts in methane and vibrational band assignment in the 5560-6200 cm-1 region. JQSRT 2009;110:964-73.
[17] Thievin J, Georges R, Carles S, Benidar A, Rowe B, Champion JP. High-temperature emission spectroscopy of methane. JQSRT 2008;109:2027-36.
[18] Wenger C, Champion JP, Boudon V. The partition sum of methane at high temperature. JQSRT 2008;109:2697-706.
Author: L.R. Brown
In the 0.76 μm, the line parameters of the oxygen A-band (![]() ) were revised for 16O2 and 16O18O, and those of 16O17O were added. The line positions, intensities, air- and self -broadened half-widths and air-induced pressure shifts were taken from the work of Robichaud et al. [1-4] who performed Cavity Ringdown Spectroscopy of the P branch. The positions now have accuracies of 0.00006 cm-1 or better for 16O2 and 16O18O and 0.00050 cm-1 for 16O17O through calibration against atomic potassium calibration standards [5]. The differences between the old and new positions are 0.0007 cm-1 for 16O2 and 0.002 cm-1 for 16O17O, but much larger for 16O18O (up to 0.20 cm-1) because the latter were based 60-year-old results [6].
) were revised for 16O2 and 16O18O, and those of 16O17O were added. The line positions, intensities, air- and self -broadened half-widths and air-induced pressure shifts were taken from the work of Robichaud et al. [1-4] who performed Cavity Ringdown Spectroscopy of the P branch. The positions now have accuracies of 0.00006 cm-1 or better for 16O2 and 16O18O and 0.00050 cm-1 for 16O17O through calibration against atomic potassium calibration standards [5]. The differences between the old and new positions are 0.0007 cm-1 for 16O2 and 0.002 cm-1 for 16O17O, but much larger for 16O18O (up to 0.20 cm-1) because the latter were based 60-year-old results [6].
Line intensities changed only slightly for the first two isotopologues: -0.8% for 16O2, +1% for 16O18O, but +/- 5% for 16O17O (depending on the rotational quanta). The accuracies are thought to be +/- 1% or better for the first two species, but more study is needed for 16O17O.
For all three species, the widths are computed via an expression from Yang et al.
[7]:
![]()
using the 16O2 constants from Table 6 of Robichaud et al. [2] based on retrievals done with Galatry (not Voigt) profiles. For the widths, the values at high quantum numbers (J>22), previously in error by more than 40% near J = 30, are now thought to be accurate to +/-2%.
Pressure shifts are still rather uncertain (+/- 0.003 cm-1) with different studies in poor agreement (e.g. [3, 8-9]). For the interim, the measured A-band pressure shifts of Robichaud et al. [1] for the P Branch and the averages of shifts from Predoi-Cross et al. [8-9] for the R branch were inserted, along with the temperature dependence of widths from Brown and Plymate [10].
Finally, it is emphasized that even with these improvements, the line parameters are not sufficient to reproduce atmospheric observations at 13100 cm-1 because Voigt line shapes are inadequate. The combined analyses of Tran and Hartmann [11], Predoi-Cross et al. [8, 7-9] and Robichaud et al. [2-4] have demonstrated the need to consider line mixing, Galatry and/or speed dependence line shapes in order to model the oxygen A-band properly.
References
[1] Robichaud DJ, Hodges JT, Maslowsk P, Yeung LY, Okumura M, , Miller CE, Brown LR. High-accuracy transition frequencies for the O2 A-band, J Mol Spectrosc 2008; 251:27-37.
[2] Robichaud DJ, Hodges JT, Brown LR, Lisak D, Maslowsk P, Yeung LY, Okumura M, Miller CE. Experimental intensity and line-shape parameters of the oxygen A-band using frequency-stabilized cavity ring-down spectroscopy, J Mol Spectrosc 2008;248:1-13.
[3] Robichaud DJ, Hodges JT, Lisak D, Miller CE, Okumura M, High-precision pressure shifting measurement technique using frequency-stabilized cavity ring-down spectroscopy, JQSRT 2008;109:435-44.
[4] Robichaud DJ, Yeung LY, Long DA, Havey DK, Hodges JT, Lisak D, Miller CE, Okumura M, Brown LR, Experimental Line Parameters of the ![]() Band of Oxygen Isotopologues at 760 nm Using Frequency-Stabilized Cavity Ring-Down Spectroscopy. J Phys Chem A 2009; doi:10.1021/jp901127h.
Band of Oxygen Isotopologues at 760 nm Using Frequency-Stabilized Cavity Ring-Down Spectroscopy. J Phys Chem A 2009; doi:10.1021/jp901127h.
[5] Falke S, Tiemann E, Lisdat C, Schnatz H, Grosche G. Transition frequencies of the D lines of K-39, K-40, and K-41 measured with a femtosecond laser frequency comb, Phys Rev 2006;A 74: 149 (art. no.-032503).
[6] Babcock HD, Herzberg L. Fine structure of the red system of atmospheric oxygen bands, Astrophys J 1948;108:167-190.
[7] Yang Z, Wennberg PO, Cageao RP, Pongetti TJ, Toon GC, Sander SP. Ground-based photon path measurements from solar absorption spectra of the O2 A-band, JQSRT 2005; 90:309-321.
[8] Predoi-Cross A, Hambrook K, Keller R, Povey C, Schofield I, Hurtmans D, Over H, Mellau GCh. spectroscopic lineshape study of the self-perturbed oxygen A-band, J Mol Spectrosc 2008;248:85-110.
[9] Predoi-Cross A, Holladay C, Heung H, Bouanich J-P, Mellau GCh, Keller R, DR Hurtmans. Nitrogen-broadened lineshapes in the oxygen A-band: Experimental results and theoretical calculations, J Mol Spectrosc 2008; 251:159-75.
[10] Brown LR, Plymate C. Experimental Line Parameters of the Oxygen A Band at 760 nm, J Mol Spectrosc 2000;199:166-79.
[11] Tran H, Hartmann J-M. An improved O2 A band absorption model and its consequences for retrievals of photon paths and surface pressures. J Geophys Res 2008 :113 :D18104,doi:10.1029/2008JD010011.
The GEISA 2003 NO line list has been totally replaced by a new one provided by Goldman [1]. The updates, since the previous one has mainly consisted in a recalculation of the Einstein coefficients and statistical weights, with in addition the implementation of hyperfine splitting for the microwave and far infrared lines. This addition has been based on adapted data generated in the course of work summarized in Goldman et al. [2]. Magnetic-dipole transitions between spin components of the ground electronic state have been newly included, as well. In the first field for upper-state rotational quantum numbers the magnetic dipole transitions have been identified by the letter ‘m’ because they obey different parity selection rules. When lines with resolved hyperfine structure were not available from Ref. [1] they have been taken from the JPL catalog [3] for addition in the new NO line list.
These updates have increased the total number of NO transitions in GEISA from 99, 123 to 105,079.
References
[1] Goldman A. Denver University, USA, private communication, 2008.
[2] Goldman A, Brown LR, Schoenfeld WG, Spencer MN, Chackerian Jr. C, Giver LP, et al. Nitric oxide line parameters: review of 1996 HITRAN update and new results. JQSRT 1998;60:825-38.
[3] Pickett HM, Poynter RL, Cohen EA, Delitsky ML, Pearson JC, Müller HSP. Submillimeter, millimetre and microwave spectral line catalog. JQSRT 1998;60:883-90.
Author: J-M Flaud
Acknowledgment: W.J. Lafferty
Sulphur dioxide is well known to be both of astrophysical and planetary importance. In the terrestrial atmosphere, SO2 is produced by both anthropogenic and natural sources, and is responsible for the production of acid rain. Once in the stratosphere, sulphur dioxide is converted into sulphate aerosols which affect both stratospheric chemistry and climate. The GEISA 2003 database [1] provided SO2 parameters in seven different spectral regions, which correspond to transitions in the microwave region and the 19.3- , 8.6- , 7.3- , 4- , 3.7- and 2.5-μm spectral regions. However in the 19.3, 8.6 and 7.3 μm spectral regions new studies [2-6] have been performed improving the corresponding spectral parameters. These three spectral regions are important for SO2 measurements in atmospheres. The 7.3 μm region which is the strongest SO2 infrared unfortunately cannot be used for ground measurements of SO2 since it is strongly overlapped with the strong ν3 band of water vapour. On the other hand, the ν1 band, although about nine times weaker corresponds to a rather clear atmospheric window. Finally the rather weak 19.3 μm region can be used for retrieving SO2 in the atmosphere of planets.
Based on the new studies an improved line list including line positions, intensities, transition assignments and lower energy levels has been generated. It includes not only the cold bands ν2, ν1 and ν3 but also the corresponding hot bands 2ν2-ν2 , 3ν2-2ν2 , ν1+ν2-ν2 and ν3+ν2-ν2 as well as the ν1,ν3, ν1+ν2-ν2, ν2+ν3-ν2, ν1+ν3 band of 34SO2, from the results of a series of papers [7-9] devoted to the high resolution study of the absorption of the 34SO2 species in the infrared. The resulting newly 34SO2 archived spectral parameters are much better than the previous ones, related only to the ν1+ν3 band. The accuracy for line positions is estimated to be better than 0.001 cm-1. For line intensities it is estimated to be of the order of 2-3% degrading up to about 15% for high J or Ka transitions.
As far as pressure broadening coefficients are concerned the situation is different for air-broadening and self-broadening coefficients.
For the air-broadening coefficients it turns out that it was only possible to estimate an average value for this parameter. In fact no variation of this parameter with respect to the lower quantum numbers J or Ka of the transitions could be determined. As an example, Figure 1 presents the measured parameters with respect to the lower quantum numbers J of the transitions. It appears not possible to derive any clear variation (The same is true when these parameters are plotted versus the quantum number Ka) so only an average value of 0.1025 cm-1/atm. could be determined.
The situation is quite different for the self broadening parameters. It was possible indeed to observe a clear variation of these parameters with respect to the Ka quantum number of the lower state of the transitions (see Fig. 2). On the other hand no variation with respect to the quantum number J could be observed. Following these results it was decided for the self broadening coefficients to include in the database the following values:
γself =0.4 cm-1/atm for Ka ≤ 5,
γself = 0.156 cm-1/atm for Ka ≥ 21
γself is calculated through a linear interpolation for 6 ≤ Ka ≤20
As a consequence, an accuracy of 10-15% for the air-broadening and self broadening parameters seems reasonable. Also, for consistency, the new broadening parameters have been used for all the SO2 lines included in the GEISA 2011 database since in the previous version different values the origin of which is not clear were used. Finally a ‘standard’ value of 0.75 has been used for the air-broadening parameter n used to account for temperature effects.
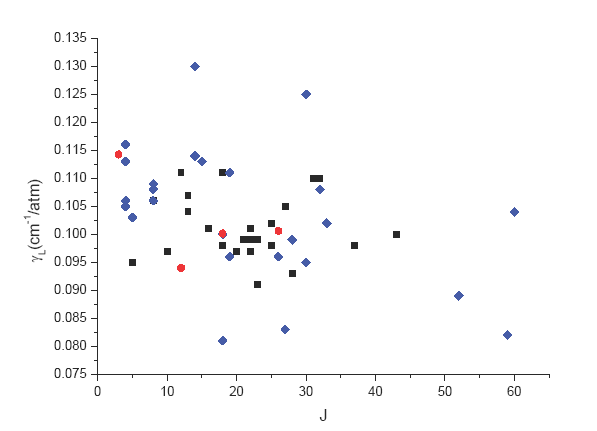
Fig. 1. 32SO2 air-broadening parameters (![]() Microwave,
Microwave, ![]() ν3 band,
ν3 band,  ν1 band) versus the quantum number J of the lower level of the transition.
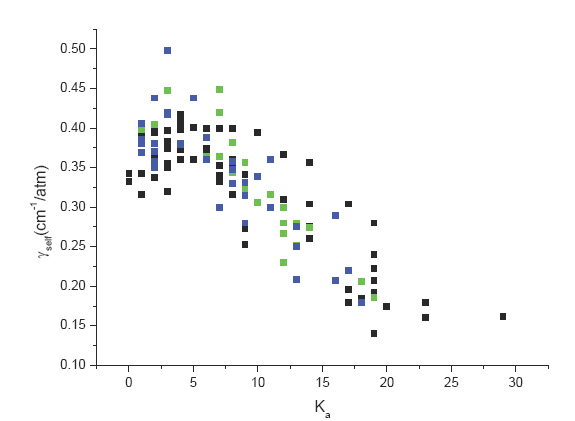
Fig. 2. 32SO2 self -broadening parameters (![]() ν2,
ν2, ![]() ν3 band, ν1 band) versus the quantum number J of the lower level of the transition.
ν3 band, ν1 band) versus the quantum number J of the lower level of the transition.
References
[1] Jacquinet-Husson N, Scott NA, Chédin A, Crépeau L, Armante R, Capelle V et al. The GEISA spectroscopic database: Current and future archive for Earth and planetary atmosphere studies. JQSRT 2008;109:1043-59.
[2] Chu PM, Wetzel SJ, Lafferty WJ, Perrin A, Flaud J-M, Arcas Ph and Guelachvili G. Line intensities for the 8 μm bands of SO2. J Mol Spectrosc 1998;189:55-63.
[3] Flaud J-M, Perrin A, Salah LM, Lafferty WJ and Guelachvili G. A reanalysis of the (010), (020), (100) and (001) rotational levels of 12S16O2 J Mol Spectrosc 1993;160:272-78.
[4] Henningsen J, Barbe A and De Backer-Barilly M-R. Revised molecular parameters for 32SO2 and 34SO2 from high resolution study of the infrared spectrum in the 7-8 μm wavelength region. JQSRT 2008;109:2491-510.
[5] Lafferty WJ, Pine AS, Hilpert G, Sams RL and Flaud J-M. The ν1+ν3 and 2ν1+ν3 band systems of SO2: line positions and intensities. J Mol Spectrosc 1996;176:280-86.
[6] Spencer JR, Lellouch E, Richter MJ, Lopez-Valverde MA, Jessup KL, Greathouse TK and Flaud J-M. Mid-Infrared Detection of Large Longitudinal Asymmetries in Io-s SO2 Atmosphere. Icarus 2005;176:283-304.
[7] Lafferty WJ, Flaud J-M, Sams RL and Ngom EHA. High resolution analysis of the rotational levels of the (000), (010), (100), (001),(020), (110) and (011) vibrational states of 34S16O2 J Mol Spectrosc 2008;252:72-6.
[8] Lafferty WJ, Flaud J-M, Ngom EHA and Sams RL 34S16O2: High Resolution analysis of the (030), (101), (111), (002) and (201) vibrational states; Determination of equilibrium rotational constants for sulfur dioxide and anharmonic vibrational constants. J Mol Spectrosc 2009;253:51-4.
[9] Flaud J-M, Lafferty WJ and Sams RL. Line Intensities for the ν1, ν3 and ν1+ ν3bands of 34SO2. JQSRT 2009;110: 669-74.
Authors: L.R. Brown and C. Benner
The study by Perrin et al. [1] provided accurate line positions and absolute intensities for several NO2 bands including the ν2? and ν3 fundamentals and their associated hot bands. Benner et al. [2] obtained precise line positions and relative intensities for the ν3 band including accurate determinations of position differences for a large number of spin-splittings. In addition, air-broadened half width and air-induced pressure shift coefficients and their variations with temperature were also determined for over 1000 transitions. These two studies [1,2] were combined to form an updated NO2 linelist at 6 μm. For the ν3 band transitions, while the measured values of half width, pressure-induced shift and the temperature dependence exponents of half width coefficients were inserted line-by-line, the positions and absolute line intensities are retained to values from [1]. For all other transitions the values calculated using the empirical expressions of Ref. [2] were applied for the half width, pressure shift and their temperature dependences. Values for higher Ka quantum numbers were constrained to the highest measured Ka (Ka =9 for half width and Ka =7 for pressure-induced shift coefficients). No pattern was discerned for the air-broadening temperature dependence exponents, and a simple linear equation in m (m = N” for P and Q branch transitions and N” + 1 for R-branch transitions) was fit to the measurements. For selected widths, the RMS deviation was 2.5%. In GEISA 2003 [3], the air-broadened half width coefficients of all transitions were set to a default value of 0.067 cm-1 atm-1 at 296 K, the self-broadened half width coefficients to 0.095 cm-1 atm-1 at 296 K, air induced pressure-shift coefficients were set to zero and the temperature dependence exponents of air-broadened half width coefficients were set to a default value of one. In the new database at 6 μm, only the self-broadened half-width coefficients remain as default values (0.095 cm-1 atm-1 at 296 K), as was done in [3].
References
[1] Perrin A, Flaud J-M, Goldman A, Camy-Peyret C, Lafferty WJ, Arcas Ph, Rinsland CP. NO2 and SO2 line parameters: 1996 HITRAN update and new results. JQSRT 1998;60:839 850.
[2] Benner DC, Blake TA, Brown LR, Devi VM, Smith MAH, Toth RA. Air-broadening parameters in the ν3 band of 14N16O2 using a multispectrum fitting technique. J Mol Spectrosc 2004; 228:593-619.
[3] Jacquinet-Husson N, Scott NA, Chédin A, Crépeau L, Armante R, Capelle V et al. The GEISA spectroscopic database: Current and future archive for Earth and planetary atmosphere studies. JQSRT 2008;109:1043-59.
Authors: I. Kleiner and L.R. Brown
The line parameters of GEISA 2003 [-1] in the spectral interval 0.058-5,294.502 cm-1 from Kleiner and Brown [2] and described in Kleiner et al. [3] have been slightly revised in GEISA 2011, on the basis of an updated line list issued just after the GEISA 2003 final process.
References
[1] Jacquinet-Husson N, Scott NA, Chédin A, Crépeau L, Armante R, Capelle V et al. The GEISA spectroscopic database: Current and future archive for Earth and planetary atmosphere studies. JQSRT 2008;109:1043-59.
[2] Kleiner I and Brown LR. Private communication, 2003.
[3] Kleiner I, Tarrago G, Cottaz C, Sagui L, Brown LR, Poynter RL, Pickett HM, Chen P, Pearson JC, Sams RL, Blake GA, Matsuura S, Nemtchinov V, Varanas, P, Fusina L, Di Lonardo G. NH3 and PH3 line parameters: 2000 HITRAN update and new results. JQSRT 2003;82:293-312
Authors: L.R. Brown and I. Kleiner
Phosphine has been detected in the atmosphere of both Jupiter and Saturn [1,2] and is a significant absorber in the 5 micron window in Jupiter where it was used to probe the deeper atmosphere [3]. Features of PH3 near 3425 cm-1 are clearly seen in ground-based spectra of Saturn [4,5], and line parameters for these bands are needed for the interpretation of data recorded by VIMS (Visible and Infrared Mapping Spectrometer) on the Cassini spacecraft [6].
Based on the work of Butler et al. [7], several new bands have been added in the region from 2724 to 3602 cm-1. The collision-broadened parameters of the 770 to 2472 cm-1 spectral range have been updated using Ref. [7].
Over 8000 line positions and intensities of phosphine between 2724.477 and 3601.652 cm-1 were measured at 0.0115 cm-1 resolution.
Quantum assignments were made to most of the eight interacting vibrational states: 3ν2 (2940.8 cm-1), 2ν2+ν4 (3085.6 cm-1), ν2+2ν4 (3214.9 cm-1), ν-1+ν2 (3307.6 cm-1), ν2+ν3 (3310.5 cm-1), 3ν4 (3345 cm-1), ν-1+ν4 (3426.9 cm-1), and ν3+ 4 (3432.9 cm-1).
However, a recent global study of PH3 by Nikitin et al [8] demonstrated the complexities of modeling the region and revealed the need to investigate the consistencies between band intensities at 5 and 3 μm.
References
[1] Burgdorf MJ, Orton GS, Encrenaz T, Davis GR, Sidher SD, Lellouch E, Swinyard BM. The FIR spectrum of Jupiter and Saturn. Planet Space Sci 2004;52(5-6):379-83.
[2] Noll KS, Larson HP. The spectrum of Saturn from 1990 to 2230 cm-1: Abundances of AsH3, CH3D, CO, GeH4, NH3, and PH3. Icarus 1991;89:168-89.
[3] Beer R, Taylor FW. Phosphine absorption in the 5-micron window of Jupiter. Icarus 1979;40:189-92.
[4] Larson HP, Fink U, Smith MHA, Davis DS. The middle-infrared spectrum of Saturn: Evidence for phosphine and upper limits to other trace atmospheric constituents. Astrophys J 1980;240:327-37.
[5] Kim JH, Kim SJ, Geballe TR, Kim SS and Brown LR. High-resolution spectroscopy of Saturn at 3 microns: CH4, CH3D, C2H2, C2H6, PH3, clouds and Haze. Icarus 2006;185:476-86.
[6] Capaccioni F, Coradini A, Cerroni P, Amici S. Imaging spectroscopy of Saturn and its satellites: VIMS-V onboard Cassini. Planet Space Sci 1998;46:1263-76.
[7] Butler RAH, Sagui S, Kleiner I, Brown LR. The absorption spectrum of phosphine (PH3) between 2.8 and 3.7 microns: Line positions, intensities, and assignments. J Mol Spectrosc 2006;238:178-92.
[8] Nikitin AV, Champion JP, Butler RAH, Brown LR, Kleiner I. Global modeling of the lower three polyads of PH3: Preliminary result. J Mol Spectrosc 2009; doi:10.1016/j.jms.2009.01.008.
Authors: A. Perrin, J.-M. Flaud, D. Petkie
A very important improvement has been brought to the entire list of lines of HNO3. In GEISA 2011, the whole GEISA 2003 content (171,504 entries in the spectral range 0.035141-1769.982240 cm-1) has been replaced, by data originating from two different sources, i.e : from Perrin [1; spectral range 0.011922 – 1769.982240 cm-1] and from Petkie [2; spectral range 0.155640 -527.247646 cm-1].
In Perrin’s work, an improved set of line positions, line intensities, line broadening parameters was generated in the infrared spectral region, using new and accurate experimental results concerning line positions and line intensities as well as sophisticated theoretical methods. The present update was performed in two steps described in Refs. [3] and [4], respectively:
– the first study [3] was performed in the 820-1770 cm-1 spectral range covered by the Michelson Interferometer for Passive Atmospheric Sounding (MIPAS) instrument and the results of this first update are summarized in Table 5 of Ref. [3]. The line positions have been improved for the ν5 and 2ν9 cold bands and ν5+ν9–ν9 hot band around 11.2 µm and for the ν8+ν9 and ν6+ν7 bands around 8.3 µm (see details in Refs. [3,5] and in the References included). In addition, the line intensities were updated in the 11.3, 8.3 and 7.6 µm spectral ranges by taking use of the cross-sections measurements performed in Ref. [6].
– the results of the second update are described in Table 1 of Ref. [4]. The intensities for the ν6 and ν8 bands centred at 646.826 and 763.154 cm-1 respectively were decreased by about 20-30% as compared to the previous GEISA 2003 version. At 11.3 µm approximate parameters for the ν5+ν7–ν7 and ν5+ν6–ν6 hot bands have been added for the first time to the line list. Also a complete update of the air-broadening parameters was performed in the 11 µm region following recent line-broadening calculations [7]. It is to be noticed that the air-broadening parameters implemented in the narrow Q branches of the ν8 and ν5+ν9–ν9 bands at 763.154 and 885.425 cm-1 respectively account empirically for line mixing effects as evidenced by laboratory measurements.
The validation of these updates in the new line list was performed during several satellite, ground based, balloon borne or satellite measurements of atmospheric HNO3 [3,8-9].
Future studies should concentrate to the improvements of HNO3 line parameters in the 7.6 µm region. Indeed this region which corresponds to the ν3 and ν4 bands located at 1325.7354 and 1303.5182 cm-1 respectively, need strong updates in term of line positions and intensities. Also, the previous studies in this region [10] did not consider resonances due to several dark states which perturb the 31 and 41 energy levels.
In Petkie’s work the catalogued spectral parameters of nitric acid have been updated in the millimeter/submillimeter-wave and 22 µm far-infrared regions. The calculated line parameters are based on the spectroscopic constants derived from the analyses of millimeter and submillimeter wave rotational spectra found in Refs. [11-13]. All predictions were calculated using SPCAT [14] for a temperature of 296 K, an isotopic abundance of 0.989, a rotational partition function of 27343, and a vibrational partition function of 1.304 [15].
– In the mm/sub-mm-wave region, the pure rotational transitions from all of the thermally populated vibrational states with band origins below 1000 cm-1 have been updated. This includes transitions in the ground state, ν9=1, ν7=1, ν6=1, ν8=1, and the interacting ν5=1/ ν9=2 dyad. The details of the analyses and measurements can be found in Refs. [11,12] and the set of references contained therein.
– In the 22 µm far-infrared spectral region, both the fundamental ν9 band was updated as well as the two hot band, 2ν9–ν9 and ν5–ν9. Line positions for the bands were calculated from the rotational analyses in Refs. [11,12] and the band origins determined in Refs. [5,16]. The high-resolution far-infrared spectrum in Ref. [17] was used both as a stringent test of the predicted far-infrared transition frequencies and to determine the relative intensities of the hot bands referenced to the intensity of the fundamental ν9 band determined in Ref. [15]. Details of the far-infrared simulation can be found in Ref. [13].
The HNO3 new GEISA 2011 line list has been processed as the following: starting from Perrin’s line list [1], Harris’s data have been included [2], replacing the Perrin’s ones of common quantum identification. The final GEISA 2011 HNO3 line list comprises 669,988 entries in the spectral range 0.011922-1769.982240 cm-1
References
[1] Perrin A. Private communication 2008.
[2] Peitkie D. Private communication 2008.
[3] Flaud JM, Brizzi G, Carlotti M, Perrin A, Ridolfi M. MIPAS database: Validation of HNO3 line parameters using MIPAS satellite measurements. Atmos Chem Phys 2006; 6:1-12.
[4] Gomez L, Tran H, Perrin A, Gamache RR, Laraia A, Orphal O, Chelin P, Fellows CE, Hartmann JM. Some improvements of the HNO3 spectroscopic parameters in the spectral region from 600 to 950cm-1. JQSRT 2009;110:675-86.
[5] Perrin A, Orphal J, Flaud JM, Klee S, Mellau G, Mäder H, Walbrodt D, Winnewisser M. New analysis of the ν5 and 2ν9 bands of HNO3 by infrared and millimeter wave techniques: line positions and intensities. J Mol Spectrosc 2004; 228:375-91.
[6] Chackerian Ch, Sharpe SW, Blake TA. Anhydrous nitric acid integrated absorption cross sections: 820-5300 cm-1. JQSRT 2003; 82: 429-41.
[7] Laraia A, Gamache RR, Hartmann JM, Perrin A, Gomez L. Theoretical Calculations of N2-broadened Half-Widths of ν5 Transitions of HNO3. JQSRT 2009;110:687-99.
[8] Mencaraglia F, Bianchini G, Boscaleri A, Carli B, Ceccherini S, Raspollini P, Perrin, A, and Flaud JM. Validation of MIPAS satellite measurements of HNO3 using comparison of rotational and vibrational spectroscopy. J Geophys Res 2006;111, D19305, doi:10.1029/2005JD006099. 2006.
[9] Tran H, Brizzi G, Gomez L, Perrin A, Hase F, Ridolfi M, Hartmann JM, Validation of HNO3 spectroscopic parameters using atmospheric absorption and emission measurements. JQSRT 2009;110:109-17.
[10] Perrin A, Lado-Bordowski O, and Valentin A. The ν3 and ν4 interacting bands of HNO3. Mol Phys 1989:67:249-70.
[11] Petkie DT, Goyette TM, Helminger P, Pickett HM, and De Lucia FC, The Energy Levels of the ν5/2ν9 Dyad of HNO3 from Millimeter and Submillimeter Rotational Spectroscopy. J Mol Spectrosc 2001;208:121-35.
[12] Petkie DT, Helminger P, Butler RAH, Albert S, and De Lucia FC, The Millimeter and Submillimeter Spectra of the Ground State and Excited ν9, ν8, ν7, and ν6 Vibrational States of HNO3. J Mol Spectrosc 2003;218:127-30.
[13] Petkie DT, Helminger P, Winnewisser BP, Winnewisser M, Butler RAH, Jucks KW and De Lucia FC, The Simulation of Infrared Bands from the Analyses of Rotational Spectra: the 2ν9–ν9 and ν5–ν9 Hot Bands of HNO3. JQSRT 2005;92:129-:41.
[14] Pickett HM, Poynter RL, Cohen EA, Delitsky ML, Pearson JC and Muller HSP, Submillimeter, Millimeter, and Microwave Spectral Line Catalog. JQSRT 1998;60:883-90.
[15] Sirota, J. M., Weber, M., Reuter, D. C., and Perrin, A., HNO3Absolute line intensities for theν9 fundamental. J Mol Spectrosc 1997;184:140-44.
[16] Goldman A, Burkholder JB, Howard CJ, Escribano R and Maki AG, Spectroscopic Constants for the ν9 Infrared Band of HNO3. J Mol Spectrosc 1988;131:195-200.
[17] Perrin A, Flaud JM, Camy-Peyret C. Winnewisser BP, Klee S, Goldman A, Murcray FJ, Blatherwick RD, Bonomo FS, Murcray DG and Rinsland CP, First analysis of the 3ν9 – ν9, 3ν9 – ν5, and 3ν9 – 2ν9 bands of HNO3: torsional splitting in the ν9 vibrational-mode. J Mol Spectrosc 1994;166:224-43.
OH (molecule 14)
No new data for this molecule. A technical error in the GEISA 2003 rotational quantum identification has been corrected in GEISA-08.
Reference
Jacquinet-Husson N, Scott NA, Chédin A, Crépeau L, Armante R, Capelle V et al. The GEISA spectroscopic database: Current and future archive for Earth and planetary atmosphere studies. JQSRT 2008;109:1043-59.
HF (molecule 15)
No update for this molecule since the GEISA 2003 Edition.
Reference
Jacquinet-Husson N, Scott NA, Chédin A, Crépeau L, Armante R, Capelle V et al. The GEISA spectroscopic database: Current and future archive for Earth and planetary atmosphere studies. JQSRT 2008;109:1043-59.
HCl (molecule 16)
No new data for this molecule. A technical error in the GEISA 2003 rotational quantum identification has been corrected in GEISA-08.
Reference
Jacquinet-Husson N, Scott NA, Chédin A, Crépeau L, Armante R, Capelle V et al. The GEISA spectroscopic database: Current and future archive for Earth and planetary atmosphere studies. JQSRT 2008;109:1043-59.
HBr (molecule 17)
No new data for this molecule. A technical error in the GEISA 2003 rotational quantum identification has been corrected in GEISA-08.
Reference
Jacquinet-Husson N, Scott NA, Chédin A, Crépeau L, Armante R, Capelle V et al. The GEISA spectroscopic database: Current and future archive for Earth and planetary atmosphere studies. JQSRT 2008;109:1043-59.
HI (molecule 18)
No new data for this molecule. A technical error in the GEISA 2003 rotational quantum identification has been corrected in GEISA-08.
Reference
Jacquinet-Husson N, Scott NA, Chédin A, Crépeau L, Armante R, Capelle V et al. The GEISA spectroscopic database: Current and future archive for Earth and planetary atmosphere studies. JQSRT 2008;109:1043-59.
ClO (molecule 19)
No new data for this molecule. A technical error in the GEISA 2003 rotational quantum identification has been corrected in GEISA-08.
Reference
Jacquinet-Husson N, Scott NA, Chédin A, Crépeau L, Armante R, Capelle V et al. The GEISA spectroscopic database: Current and future archive for Earth and planetary atmosphere studies. JQSRT 2008;109:1043-59.
Author: L.R. Brown
Substantial revisions involving five isotopologues 16O12C32S, 16O12C34S, 16O13C32S, 16O12C33S, and 18O12C32S provide new parameters for some 50 bands between 3800 and 4200 cm-1; 13 allowed and two forbidden arise from the ground state while the remainder are hot bands. The number of transitions increases from ~1100 transitions (for 2ν3 of five isotopologues and the ν2+2ν3–ν2 of 16O12C32S and 16O12C34S) to 10,425 lines. Most of the line positions are calculated using the effective rovibrational energy constants based on the global analysis [1, 2, 3, 4, 5] whose line position accuracy was reported to be 5×10⁻⁵ cm-1 [1]. The calculated line intensities are taken from analyses of new FTIR measurements [6,7] performed at JPL to support Venus studies. Sung et al. [6] reported line intensities of the 2ν3 band at 4101.387 cm-1, ν1+2ν2+ν3 at 3937.421 cm-1, and 4ν2+ν3 at 4141.212 cm-1 of 16O12C32S. The new band strengths are in good agreement (1.3%) with the prior studies by Bermejo et al. [8]and Näim et al. [1]. Intensities of all the other bands are determined by Toth et al. [7] with many bands being measured for the first time, and their uncertainties range from 1 to 6% depending on bands. The line intensities vary through five orders of magnitude, but very weak unassigned features are omitted from the database pending further analysis.
The air- and self-broadened half-widths are computed, respectively, using Refs. [9-11] and [12]. The self-broadened temperature dependences of ν1 from Bouanich et al. [12] are applied for the air-broadening in this region. For the transitions whose J values are greater than 65 and 75, their air- and self-broadened half-widths are set to 0.12 cm-1/atm and 0.0817 cm-1/atm, respectively. Air-pressure induced frequency shifts for OCS of 2ν3 reported by Domenech et al. [13] are inserted for the first time. In a separate parameter file, the air-broadened OCS half-widths are replaced by CO2-broadened half widths, using the measurements of Bouanich et al. [14] in the ν1 band of OCS. This 2nd database is intended to support remote sensing of Venus at 2.5 μm.
References
[1] Naim S, Fayt A, Bredohl H, Blavier J-F, Dubois I. Fourier transform spectroscopy of carbonyl sulfide from 3700 to 4800 cm-1 and selection of a line-point program. J Mol Spectrosc 1998;192:91-101.
[2] Fayt A, Vandenhaute R, Lahaye J-G. Global rovibrational analysis of carbonyl sulfide. J Mol Spectrosc 1986;119:233-66.
[3] Lahaye J-G, Vandenhaute R, Fayt A. CO2 laser saturation Stark spectra and global rovibrational analysis of the main isotopic species of carbonyl sulfide (OC34S, O13CS, and 18OCS). J Mol Spectrosc 1987;123:48-83.
[4] Masukidi LS, Lahaye J-G, Fayt A. Intracavity CO and CO2 laser Stark spectroscopy of the isotopomers of carbonyl sulfide.J Mol Spectrosc 1992;154:137-62.
[5] Strugariu T, Naim S, Bredohl H, Blavier J-F, Dubois I. Fourier transform spectroscopy of 18O-enriched carbonyl sulfide from 1825 to 2700 cm-1. J Mol Spectrosc 1998;89:206-19.
[6] Sung K, Toth RA, Brown LR, Crawford TJ. Line strength measurements of Carbonyl Sulfide (16O12C32S) in the 2ν3, ν1+2ν2+ν3, and 4ν2+ν3 bands. JQSRT 2009, doi:10.1016/j.jqsrt.2009.05.013
[7] Toth RA, Sung K, Brown LR, Crawford TJ. Spectroscopy of carbonyl sulfide near 4100 cm-1. JQSRT, in preparation.
[8] Bermejo D, Domenech JL, Bouanich J-P, Blanquet G. Absolute line intensities in the 2v3 band of 16O12C32S. J Mol Spectrosc 1997;185: 26-30.
[9] Mouchet A, Blanquet G, Herbin P, Walrand J, Courtoy CP. Diode laser measurements of N2-broadened linewidths in the ν1 band of OCS. Can J Phys 1985;63:527-31.
[10] Bouanich JP, Walrand J, Alberty S, Blanquet G. Diode laser measurements of oxygen-broadened linewidths in the ν1 band of OCS. J Mol Spectrosc 1987;123:37-47.
[11] Bouanich JP, Blanquet G. Pressure broadening of CO and OCS spectral lines. JQSRT 1988;40:205-20.
[12] Bouanich JP, Blanquet G, Walrand J, Courtoy CP. Diode laser measurements of line strengths and collisional half-widths in the ν1 band of OCS at 298 and 200 K. JQSRT 1986;36:295-306.
[13] Domenech JL, Bermejo D, Bouanich JP. Pressure lineshift and broadening coefficients in the 2ν3 band of OCS. J Mol Spectrosc 2000;200:266-76.
[14] Bouanich J-P, Campers C, Blanquet G, Walrand J. Diode-laser measurements of Ar- and CO2-broadened linewidths in the ν1 band of OCS, JQSRT 1988;39:353-65.
Author: A. Perrin
Acknowledgements: D. Jacquemart, F. Kwabia-Tchana, N. Lacome
Formaldehyde (H2CO) in the atmosphere can be retrieved in the 5.7 µm region by MIPAS (Michelson Interferometer for Passive Atmospheric Sounding) aboard the ENVISAT satellite [1] and by the Atmospheric Chemistry Experiment (ACE-FTS) instrument on board the Canadian satellite SCISAT–1 at 3.6 µm [2]. For this reason the major update for H2CO in the infrared region which concerns the line positions and line intensity parameters involves the complete replacement of the line list at 3.6 µm and the addition of a list at 5.7 µm [3].
The line positions were generated using the models and the parameters described in details in Refs [4,5] and [6] for the 5.7 µm and 3.6 µm, respectively. The 5.7 µm corresponds to the ν2 band together with three dark bands. In the 3.6 µm region the lines belong to the ν1 and ν5 bands together with nine dark bands. In addition a consistent set of line intensity parameters was generated for both the 5.7 and 3.6 µm spectral regions [3] using high-resolution Fourier transform spectra recorded for the whole 1600-3200 cm-1 spectral range. The calculated band intensities derived for the 5.7 and 3.6 µm bands are in excellent agreement with the values achieved recently by medium resolution band intensity measurements.
As compared to the GEISA 2003 line list which involves only 1161 lines at 3.6 µm, the quality of the line parameters is significantly improved in term of the quality of the positions and intensities. Details giving the description of the new database which involves 3713 and 31796 transitions at 5.7 and 3.6 µm, respectively, are given in Table 9 of Ref. [3]. A subsequent and complementary study dealing with measurements and calculations of formaldehyde pressure induced self- and N2-broadening coefficients is in progress.
Figure 1 illustrates the extended H2CO line parameter information included in GEISA 2011
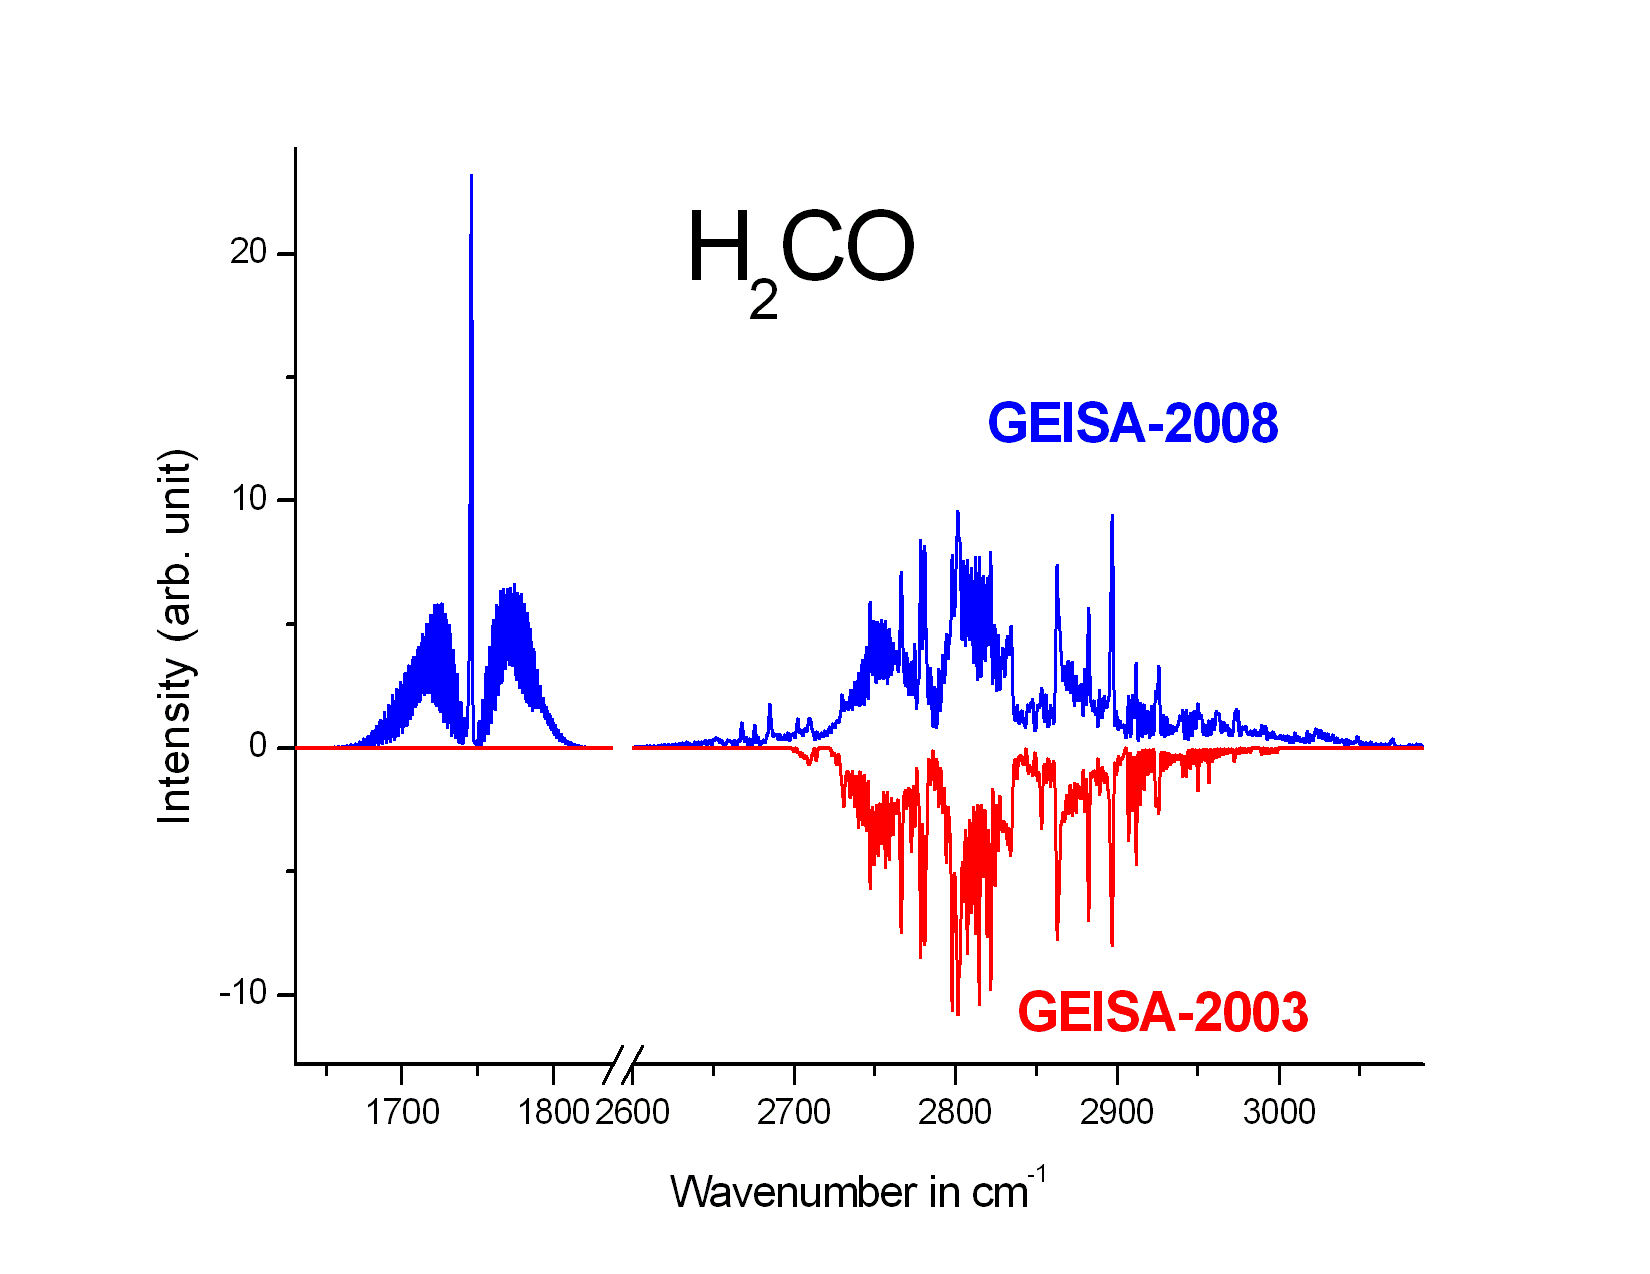
Fig. 1: Overview of the H2CO line parameters in the 5.7 µm and 3.6 µm. The upper and lower traces describe the status in GEISA-2011 and GEISA2003, respectively.
References
[1] Steck T, Glatthor N, von Clarmann T, Fischer H, Flaud JM, Funke B, Grabowski U, Höpfner M, Kellmann S, Linden A, Perrin A, Stiller GP. Retrieval of global upper tropospheric and stratospheric formaldehyde (H2CO) distributions from high-resolution MIPAS-Envisat spectra. Atmos Chem Phys 2008;8:463-70.
[2] Dufour G, Szopa S, Barkley MP, Boone CD, Perrin A, Palmer P, and Bernath PF. Global upper tropospheric formaldehyde seasonal cycles investigated through ACE-FTS space borne observations. Atmos Chem Phys 2009;9:3893-3910.
[3] Perrin A, Jacquemart D, Kwabia Tchana F, Lacome N. Absolute line intensities measurements and calculations for the 5.7 and 3.6 µm bands of formaldehyde, JQSRT 2009;110:700-16.
[4] Kwabia Tchana F, Perrin A, Lacome N. New analysis of the ν2 band of formaldehyde (H212C16O). J Mol Spectrosc 2007;245:141-44. Kwabia Tchana F, Perrin A, Lacome N, Corrigendum to “New analysis of the ν2 band of formaldehyde (H212C16O): Line positions for the ν2, ν3, ν4 and ν6 interacting bands”. J Mol Spectrosc 2008;250:57-57.
[5] Margulés L, Perrin A, Janeckovà R, Bailleux S, Endres CP, Giesen TF, and Schlemmer S. Rotational transitions within the ν2, ν3, ν4 and ν6 bands of formaldehyde H212C16O. Can J Phys 2009;87:425-35.
[6] Perrin A, Valentin A, Daumont L. New analysis of the ν1, ν5, 2ν4, ν4+ν6, 2ν6, ν3+ν4, ν3+ν6, ν2+ν4, 2ν3, ν2+ν6, and ν2+ν3 bands of formaldehyde H2CO. Line positions and intensities in the 3.6 µm spectral region. J Mol Struct 2006;780-782:28-44.
Author: J. Vander Auwera and N. Moazzen-Ahmadi
The GEISA 2003 line list for the ν9 and ν12 fundamental bands of 12C2H6 around 12 μm was from a 1992 analysis by Daunt et al. [1]. In the updated 2008 edition, only the ν12 band has been kept; the ν9 band has been replaced with a new list which includes a total of 21607 lines belonging to the ν9, 3ν4, ν9+ ν4– ν4, and ν9+2ν4-2ν4 bands (ν4 is the torsional mode, near 289.3 cm-1). It was generated by Vander Auwera et al. [2] using a spectrum of the ν9 band recorded at the Pacific Northwest National Laboratory [3], results from a global analysis of data involving the four lowest vibrational states of ethane [4] and measurements of pressure-broadening parameters [5,6]. Details can be found in [2]. As a result, the sum of the line intensities and wavenumber coverage in the 12 μm region are increased from 5.881 10-19 to 1.011 10-18 cm-1/(molecule cm-2) at 296 K (natural abundance) and from 725.6 – 900.0 cm-1 to 706.6 – 961.2 cm-1, respectively. As shown by Nixon et al. [7], the new list for the 12 μm spectral region of 12C2H6 constitutes a significant improvement over previously available data, leading to the first measurement of 12C/13C isotopic ratio of C2H6 in the atmosphere of Titan. Note that the quantum number notation for representing rotation-torsion states has evolved since the GEISA 2003 edition [8]. In [2], the levels are identified by J, the quantum number for the total angular momentum of the molecule, K, the quantum number for its component along the symmetry axis, ι, the quantum number associated with the vibrational angular momentum of the degenerate mode ν9, and σ = 0-3 which labels the torsional sublevels. In the new line list archived in GEISA 2011, the latter is replaced by the symmetry species A1s, A2s, A3s, A4s, E1s, E2s, E3s, E4s and Gs in the G36+ extended permutation-inversion group. Because all the allowed species are s-species, the letter ‘s’ is omitted: for instance, E1s symmetry is given as ‘E1’ and A1s+A2s is given as ‘A12’. The symmetry of the vibration-rotation-torsion levels of 12C2H6 corresponding to the excitation of ν9 and ν4 is given in Table 1. This new notation is common to GEISA 2011 and HITRAN-08 [9]. In GEISA 2011, the former notation has been kept for the ν12 fundamental band.
In the 3.3 μm region, the ν7 fundamental band of 12C2H6 exhibits a number of strong unresolved Q-branches (pQ4 to rQ4), observed between 2973 and 3001 cm–1. GEISA contained a list of 421 lines belonging to the pQ3 branch observed near 2976 cm–1, generated by Pine and Rinsland [11]. To complement this rather limited information, the line positions and intensities determined for the other strong Q-branches by Goldman et al [12, 13] have been added to this edition, even though the data is now quite dated and only allow a rather approximate modeling of the observed structure of the branches. The other line parameters have been set to the same values as for the ν9 band. The quantum number labeling of all the levels and the symmetry of torsionaly split levels are also as for the ν9 band. The symmetry of levels involving unresolved torsional components is expressed using the species of the D3d group, i.e. A1g (8), A1u (8), A2g (16), A2u (16), Eg (20) and Eu (20) (the numbers between parentheses are the nuclear spin statistical weights [9]).
Table -1. Symmetry in the G36+ extended permutation-inversion group of vibration-rotation-torsional levels of 12C2H6 involving the excitation of the ν9 bending and ν4 torsional modes of vibration. J and K are respectively the quantum numbers associated to the total angular momentum of the molecule and its projection along the molecule top 3-fold symmetry axis, σ= 0-3 is the torsional index and G = K – ι with ι = +/-1 the vibrational angular momentum quantum number associated to ν9.n is a non zero positive integer. The nuclear spin statistical weights are given in parentheses [10]. Empty cells correspond to non-existing levels.
a) v9 = even, v4 = even
|
K |
J |
σ = 0 |
σ = 1 |
σ = 2 |
σ = 3 |
|
0 |
even |
A1s (6) |
E3s (2) |
||
|
odd |
A2s (10) |
E4s (6) |
|||
|
6n+/-1 |
Gs (16) |
E1s (4) |
|||
|
6n+/-2 |
E1s (4) |
Gs (16) |
|||
|
6n+3 |
E3s+E4s (8) |
A1s+A2s (16) |
|||
|
6n |
A1s+A2s (16) |
E3s+E4s (8) |
b) v9 = even, v4 = odd
|
K |
J |
σ = 0 |
σ = 1 |
σ = 2 |
σ = 3 |
|
0 |
even |
A3s (6) |
E3s (2) |
||
|
odd |
A4s (10) |
E4s (6) |
|||
|
6n+/-1 |
Gs (16) |
E2s (4) |
|||
|
6n+/-2 |
E2s (4) |
Gs (16) |
|||
|
6n+3 |
E3s+E4s (8) |
A3s+A4s (16) |
|||
|
6n |
A3s+A4s (16) |
E3s+E4s (8) |
c) v9 = odd, v4 = even
|
G |
K |
J |
σ = 0 |
σ = 1 |
σ = 2 |
σ = 3 |
|
0 |
≥ 0 |
even |
A3s (6) |
E3s (2) |
||
|
odd |
A4s (10) |
E4s (6) |
||||
|
< 0 |
even |
A4s (10) |
E4s (6) |
|||
|
odd |
A3s (6) |
E3s (2) |
||||
|
6n+/-1 |
Gs (16) |
E2s (4) |
||||
|
6n+/-2 |
E2s (4) |
Gs (16) |
||||
|
6n+3 |
E3s+E4s (8) |
A3s+A4s (16) |
||||
|
6n |
A3s+A4s (16) |
E3s+E4s (8) |
d) v9 = odd, v4 = odd
|
G |
K |
J |
σ = 0 |
σ = 1 |
σ = 2 |
σ = 3 |
|
0 |
≥ 0 |
even |
A1s (6) |
E3s (2) |
||
|
odd |
A2s (10) |
E4s (6) |
||||
|
< 0 |
even |
A2s (10) |
E4s (6) |
|||
|
odd |
A1s (6) |
E3s (2) |
||||
|
6n+/-1 |
Gs (16) |
E1s (4) |
||||
|
6n+/-2 |
E1s (4) |
Gs (16) |
||||
|
6n+3 |
E3s+E4s (8) |
A1s+A2s (16) |
||||
|
6n |
A1s+A2s (16) |
E3s+E4s (8) |
References
[1] Daunt SJ, Atakan AK, Blass WE, Halsey GW, Jennings DE, Reuter DC, Susskind J, Brault JW. The 12 micron band of ethane: High-resolution laboratory analysis with candidate lines for infrared heterodyne searches. Astrophys J 1984;280:921-36.
[2] Vander Auwera J, Moazzen-Ahmadi N, Flaud JM. Toward an accurate database for the 12 μm region of the ethane spectrum. Astrophys J 2007;662:750-7.
[3] Sharpe SW, Johnson TJ, Sams RL, Chu PM, Rhoderick GC, Johnson PA. Gas-phase databases for quantitative infrared spectroscopy. Appl Spectrosc 2004;58:1452-61.
[4] Cooper JR, Moazzen-Ahmadi N. Global fit analysis including the ν9+ν4–ν4 hot band of ethane: Evidence of an interaction with the ν12 fundamental. J Mol Spectrosc 2006;239:51-8.
[5] Blass WE, Halsey GW, Jennings DE. Self- and foreign-gas broadening of ethane lines determined from diode laser measurements at 12 μm. JQSRT 1987;38:183-4.
[6] Pine AS, Stone SC. Torsional tunneling and A-1-A2 splittings and air broadening of the rQ0 and PQ3 sub-branches of the ν7 band of ethane. J Mol Spectrosc 1996;175:21-30.
[7] Nixon CA, Achterberg RK, Vinatier S, Bézard B, Coustenis A, Irwin PGJ, Teanby NA, de Kok R, Romani PN, Jennings DE, Bjoraker GL, Flasar FM. The 12C/13C isotopic ratio in Titan hydrocarbons from Cassini/CIRS infrared spectra. Icarus 2008;195:778-91.
[8]Jacquinet-Husson N, Scott NA, Chédin A, Crépeau L, Armante R, Capelle V et al. The GEISA spectroscopic database: Current and future archive for Earth and planetary atmosphere studies. JQSRT 2008;109:1043-59.
[9]Rothman LS, Gordon IE, Barbe A, Chris Benner D, Bernath PF, Birk M, Boudon V, Brown LR, Campargue A, Champion J-P, Chance K, Coudert LH, Dana V, Devi VM, Fally S, Flaud J-M, Gamache RR, Goldman A, Jacquemart D, Kleiner I, Lacome N, Lafferty WJ, Mandin J-Y, Massie ST, Mikhailenko SN, Miller CE, Moazzen-Ahmadi N, Naumenko OV, Nikitin AV, Orphal J, Perevalov VI, Perrin A, Predoi-Cross A, Rinsland CP, Rotger M, Simeckova M, Smith MAH, Sung K, Tashkun SA, Tennyson J, Toth RA, Vandaele AC, J.VanderAuwera J. The HITRAN 2008 molecular spectroscopic database. JQSRT 2009;110:533-72.
[10] Hougen JT. Perturbations in the vibration-rotation-torsion energy levels of an ethane molecule exhibiting internal rotation splittings. J Mol Spectrosc 1980;82:92-116.
[11] Pine AS, Rinsland CP. The role of torsional hot bands in modeling atmospheric ethane. JQSRT 1999;62:445-58.
[12] Dang-Nhu M, Goldman A. Line parameters for C2H6 in the 3000 cm–1 region. JQSRT 1987;38:159-61.
[13] Goldman A, Dang-Nhu M, Bouanich JP. Ethane 3 μm spectral clusters of atmospheric interest. JQSRT 1989;41:17-21.
Author: L.R. Brown and I. Kleiner
For the GEISA-2008 modifications, nine new infrared bands were added at three different wavelengths (8, 2.9 and 1.56 μm). In addition, a far-IR prediction from the Cologne Database for Molecular Spectroscopy (CDMS) [1], based on the frequency analysis of Lattanzi [2], was included. The 13CH3D species was added to the database for the first time because the isotopologue 13CH3D was recently detected in Titan?s stratosphere [3], using Cassini/CIRS infrared spectrum near 8.7 μm. Fitting simultaneously the ν6 band of both 13CH3D and 12CH3D and the ν4band of CH4, this detection allowed a precise determination of the D/H ratio in methane and yielded a 12C/13C ratio in 13CH3D consistent with that measured in normal methane.
A prediction of the 13CH3D triad (ν6, ν3 and ν5) between 952 and 1694 cm-1 was based on the line positions and energy levels analysis by Ulenikov et al. [4]. The intensities were calculated using the transition dipole moment parameters of the 12CH3D from Brown et al. [5]. The calculations were limited to J = K = 18 as they are the maximum quantum numbers covered by the experimental rovibrational terms values published in ref [4].
Titan and Saturn observations [6,7] also revealed the need for additional parameters at 2.9 μm. Six new 12CH3D vibrational bands (ν2+ν3, ν2+ν5, ν2+ν6, ν3+2ν6 and 3ν6) were included for the first time from the analysis of positions and line intensities of by Nikitin et al. [8]. Finally, the Boussin et al. [9] empirical line-list in the 3ν2 region at 1.56 μm was included. The self- and air-broadened widths were generally applied using empirical formula obtained from 12CH3D Triad measurements [10]; however, self- and air-broadened widths and shifts observed by Boussin et al. [9] were used for 3ν2. For temperature dependence of widths, CH4 values averaged by J [11] were used as a rough estimate. Additional laboratory and theoretical studies are needed to improve complete and improve the new mid- and near-IR parameters.
References
[1] Müller HSP, Thorwirth S, Roth DA, and Winnewisser G. The Cologne Database for Molecular Spectroscopy, CDMS. Astronom. & Astrophys. 2001;370:L49-L52; Müller HSP, Schlöder F, Stutzki J, Winnewisser G. The Cologne Database for Molecular Spectroscopy, CDMS: a useful tool for astronomers and spectroscopists. J Mol Struct 2005;742:215-27.
[2] Lattanzi V, Walters A, Pearson JC, Drouin BJ. THz spectrum of monodeuterated methane. JQSRT 2008;109:580-6.
[3] Bézard B, Nixon CA, Kleiner I, Jennings DE. Detection of 13CH3D on Titan. Icarus 2007;191:397-400.
[4] Ulenikov ON, Onopenko GA, Tyabaev NE, Anttila R, Alanko S, Schroderus J. Rotational analysis of the ground state and the lowest fundamentals ν3, ν5, and ν6 of 13CH3D. J Mol Spectrosc 2000;201:9-17.
[5] Brown LR, Nikitin A, Benner DC, Devi VM, Smith MAH, Fejard L, Champion J-P, Tyuterev VlG, Sams RL. Line intensities of CH3D in the Triad region: 6-10 μm. J Mol Struct 2004;695-696:181-8.
[6] Seo H, Kim SJ, Kim JH, Geballe TR, Courtin R, Brown LR. Titan at 3 microns: Newly identified spectral features and an improved analysis of haze opacity. Icarus 2009;199:449-57.
[7] Kim JH, Kim SJ, Geballe TR, Kim SS, Brown LR. High-resolution spectroscopy of Saturn at 3 microns: CH4, CH3D, C2H2, C2H6, PH3, clouds, and haze. Icarus 2006;185:476-86.
[8] Nikitin A, Champion JP, Brown LR. Preliminary analysis of CH3D from 3250 to 3700 cm-1. J Mol Spectrosc 2006;240:14-25.
[9] Boussin C, Lutz BL, De Bergh C, Hamdouni A. Line intensities and self-broadening coefficients for the 3ν2, band of monodeuterated methane. JQSRT 1998;60:501-14 (and private communication DeBergh C).
[10] Devi VM, Benner DC, Smith MAH, Rinsland C, Brown LR.. Self- and Nitrogen- broadening, pressure induced shift and line mixing coefficients in the ν5 of 12CH3D using a multi-spectrum fitting procedure. JQSRT 2002;74:1-41.
[11] Brown LR, Benner DC, Champion JP, Devi VM, Fejard L, Gamache RR, Gabard T, Hilico JC, Lavorel B, Löte M, Mellau GCh, Nikitin A, Pine AS, Predoi-Cross A, Rinsland CP, Robert O, Sams RL, Smith MAH, Tashkun SA, Tyuterev VlG. Methane line parameters in HITRAN. JQSRT 2003;82:219-38.
Authors : D. Jacquemart, V. Dana, J.-Y. Mandin, J. Vander Auwera
Up to now, the data available for acetylene, namely 12C2H2 and 12C13CH2, in GEISA were limited to the lower energy region of the spectrum, up to 3 μm. This edition sees the extension into the near infrared range of the information available for these two isotopologues, with the inclusion of a list of line parameters generated by El Hachtouki and Vander Auwera [1] and D. Jacquemart et al. [2,3]. In the 1.5 μm region, corresponding to the simultaneous excitation of the symmetric and antisymmetric C-H stretching modes ν-1 and ν 3 respectively, the line list was created following the high-resolution intensity study [1]. The identification of the lines, their positions and lower state energies are from Kou et al. [4], and the line intensities are calculated using the parameters of Table 7 of [1]. Note that there is a mistake in [1]: the isotopic abundance used for 12C13CH2 is a factor 2 too small; it should read 0.02176 instead of 0.01088. As a result, the vibrational transition dipole moments of 12C13CH2 listed in Tables 6 and 7, and in Fig. 7 of [1] are a factor 2 too large. The list included in GEISA contains the corrected values. Also, a large update has been performed for the 12C2H2 isotopologue and led to new data in nine spectral regions, namely, in the regions around 3.8, 3, 2.5, 2.2, 1.9, 1.7, 1.5, 1.4, 1.3, 1.2, and 1 μm. The new line lists are described in details in Refs. [2,3]. Corrections of the 2.5 and 3.8 μm spectral regions of 12C2H2 [2.24.1, 2.24.2] have also been performed and are described in Ref. [2]. Table -1 summarizes the number of new bands and transitions of the spectral regions added in the GEISA 2011 issue, together with the intensity ranges and involved spectral domains. Figure 1 illustrates the noticeable improvements brought to the GEISA 2011 edition.
These data improve and summarize the current experiment spectroscopic knowledge on acetylene. Several of the involved spectral regions are of atmospheric, planetologic, astrophysical, or metrologic interest, e.g., at 3, 2.2, 1.5, and 1 μm. The study of the region at 7.7μm, very useful for applications, is in progress [7]. In this spectral region, intensity measurements were undertaken because the knowledge of C2H2 line intensities is important for several applications, especially for astrophysical ones. For example, the acetylene molecule has been observed in the circumstellar envelopes of carbon-rich stars. Using the Infrared Spectrograph (IRS) on board the Spitzer Space Telescope (SST), Matsuura et al. [8] detected acetylene bands at 7 and 14 μm in carbon-rich asymptotic giant branch stars in the Large Magellanic Cloud. Around 7 μm, GEISA 2011 only contains line positions and intensities that Vander Auwera calculated from his absolute measurements in the (n4+n5)0+ band [9], for the rotational quantum number J up to 35. But intensities measured in [9] for some lines of the (n4+n5)2 band are not reported in the databases. The temperature of interest for applications being around 500 K [8], the knowledge of intensities in the remaining hot bands is also important. In the quoted paper [8], Matsuura et al could not reproduce the shapes that they observed in their IRS-SST spectra around 7 μm because of the lack of data in databases.
Table 1
Summary of the bands and transitions added for the 12C2H2 molecule in the GEISA 2011 database
___________________________________________________________________________
Spectral Number of Number of Spectral Intensity
region bands a transitions a domain range
(μm) cold / hot cold / hot (cm -1) (cm molecule-1 at 296K)
___________________________________________________________________________
3.8 b 2 / 3 90 / 331 2499-2769 10–21 – 10–25
3 c 0 / 18 77e/ 1971 3139-3398 10–20 – 10–26
2.5 b 4 / 5 450 / 720 3762-4226 10–21 – 10–27
2.2 c 4 / 4 254 / 392 4421-4798 10–22 – 10–25
1.9 c 7 / 0 539 / 0 5032-5567 10–24 – 10–26
1.7 c 2 / 4 175 / 350 5692-6032 10–23 – 10–26
1.5 e 2 / 2 129 / 224 6448-6685 10–20 – 10–24
1.5 c 4 / 16 200 / 1443 6277-6865 10–23 – 10–28
1.4 c 4 / 0 347 / 0 7042-7476 10–22 – 10–25
1.3 d 1 / 0 51 / 0 7671-7791 10–25 – 10–24
1.2 d 2 / 0 132 / 0 8407-8612 10–26 – 10?23
1.0 d 3 / 1 193 / 108 9516-9890 10–25 – 10–22
___________________________________________________________________________
a 12C13CH2 data are not mentioned.
b New data from Refs. [1,4]
c New data from Ref. [2,3]
d New data from Ref. [3]
e New data from Ref. [-1]
Fig 1. Improvement of data now available in GEISA 2011 for the 12C2H2 isotopologue of acetylene.
References
[1] El Hachtouki R, Vander Auwera J. Absolute line intensities in acetylene: the 1.5 μm region. JQSRT 2002;216:355-62.
[2] Jacquemart D, Lacome N, Mandin JY, Dana D, Tran H, Gueye FK, Lyulin OM, Perevalov VI, Régalia-Jarlot L. The IR spectrum of 12C2H2: line intensity measurements in the 1.4 μm region and update of the databases. JQSRT 2009;110:717-32.
[3] Jacquemart D, Lacome N, Mandin JY. Line intensities of 12C2H2 in the 1.3, 1.2, and 1 μm spectral regions. JQSRT 2009;110,733-42.
[4] Kou Q, Guelachvili G, Abbouti Temsamani M, Herman M. The absorption spectrum of C2H2 around ν-1+ ν3: energy standards in the 1.5 μm region and vibrational clustering. Can J Phys 1994;72:1241-50.
[5] Lyulin OM, Perevalov VI, Mandin JY, Dana V, Gueye F, Thomas X, Von der Heyden P, Décatoire D, Régalia-Jarlot L, Jacquemart D, Lacome N. Line intensities of acetylene: Measurements in the 2.5-μm spectral region and global modeling in the ?p = 4 and 6 series. JQSRT 2007;103:496-523.
[6] Jacquemart D, Lacome N, Mandin JY, Dana V, Lyulin OM, Perevalov VI. Multispectrum fitting of line parameters for 12C2H2 in the 3.8 μm spectral region. JQSRT 2007;103:478-495.
[7] Gomez L, Jacquemart D, Lacome N, Mandin J.-Y. Line intensities of 12C2H2 in the 7.7 μm spectral region. JQSRT 2009; doi:10.1016/j.jqsrt.2009.05.018
[8] Matsuura M, Wood PR, Sloan GC, Zijlstra AA. Spitzer observations of acetylene bands in carbon-rich asymptotic giant branch stars in the Large Magellanic Cloud. Mon Not R Astron Soc 2006;371:415-20.
[9] Vander Auwera J. Absolute intensities measurements in the (ν4 + ν5) band of 12C2H2: analysis of Hermann-Wallis effects and forbidden transitions. J Mol Spectrosc 2000;201:143-50.
Authors: M. Rotger, J. Vander Auwera, V. Boudon
The spectroscopic information available for ethylene in GEISA 2003 was updated with the 1997 edition. It includes the 10 and 3.3 μm spectral regions of the main isotopologue and the 3.3 μm region of 12C13CH4 [1]. The 10 μm region of 12C2H4 involves the ν10, ν7, ν4 and ν12 bands observed near 826, 949, 1027 and 1442 cm-1, respectively. The first three bands are in GEISA [1], while the last one is absent. Recently, Rotger et al. [2] carried out an experimental and theoretical study of line positions and intensities in the ν12 band of 12C2H4. 1240 line positions and 871 intensities, measured in a set of Fourier transform spectra recorded in Brussels, were fitted using the tensorial formalism developed in Dijon with global root mean square deviations of 1.6x10⁻⁴ cm-1 and 1.88 %, respectively [2]. Using the refined model thus obtained, the positions, intensities and lower state energies of 5400 lines in the ν12 band were calculated. These lines correspond to transitions from levels with J ≤ 40, and lower and upper state rotational energies up to 1380 and 1510 cm-1, respectively. This initial list of line parameters was complemented with the self- and air-broadening parameters, and the temperature dependence of the air-broadening parameter based on literature [3-6] (see [2] for details). This ν12 band line list, whose content is summarized in Table 25.1, has been added to the present 2011 edition of GEISA.
Table -1
Summary of the content of the linelist for the ν12 band of 12C2H4. The intensities are given at 296 K for an isotopic abundance of 0.9773.
|
Value |
Value |
||
|
F-min (cm-1) |
1380.0239 |
Int-min [cm-1/(molecule cm-2)] |
2.764 10-37 |
|
F-max (cm-1) |
1509.9819 |
Int-max [cm-1/(molecule cm-2)] |
6.948 10-21 |
|
J”max |
40 |
Int-sum [cm-1/(molecule cm-2)] |
1.549 10-18 |
|
Ka” max |
20 |
γair-min (cm-1atm-1) |
0.0813 |
|
# lines |
5400 |
γair-max (cm-1atm-1) |
0.0989 |
|
n |
0.82 |
γself (cm-1atm-1) |
0.125 |
References
[1] Jacquinet-Husson N et al. The 1997 spectroscopic GEISA databank. JQSRT 1999;62:205-54.
[2] Rotger M, Boudon V, Vander Auwera J. Line positions and intensities in the ν12 band of ethylene near 1450 cm-1: An experimental and theoretical study. JQSRT 2008;109:952-62.
[3] Blanquet G, Bouanich JP, Walrand J, Lepère M. Self-broadening coefficients in the ν7 band of ethylene at room and low temperatures. J Mol Spectrosc 2003;222:284-90.
[4] Brannon JF, Varanasi P. Tunable diode laser measurements on the 951.7393 cm-1 line of 12C2H4 at planetary atmospheric temperatures. JQSRT 1992;47:237-42.
[5] Reuter DC, Sirota JM. Absolute intensities and foreign gas broadening coefficients of the 111,10 ← 112,10 and 180,18 ← 181,18 lines in the ν7 band of C2H4. JQSRT 1993;50:477-82.
[6] Blanquet G, Walrand J, Bouanich JP. Diode-laser measurements of N2-broadening coefficients in the ν7 band of C2H4. J Mol Spectrosc 2000;201:56-61.
GeH4 (molecule 26)
No update for this molecule since the GEISA 2003 Edition.
Reference
Jacquinet-Husson N, Scott NA, Chédin A, Crépeau L, Armante R, Capelle V et al. The GEISA spectroscopic database: Current and future archive for Earth and planetary atmosphere studies. JQSRT 2008;109:1043-59.
Authors: G. Harris, A. Maki, J. Tennyson
A major improvement has been accomplished on the entire list of lines of HCN.
The whole GEISA 2003 content (2550 entries in the spectral range 2.870484 – 18407.972700 cm-1) has been replaced, in GEISA 2011, by data originating from two different sources, i.e : from Harris [1] and from Maki [2]. The new line list comprises 82042 entries in the spectral range 0.00636-17943.253477 cm-1
Greg Harris’s [1] data are related to the main isotopic species H12C14N. Among a total of 108402 entries, 28624 have been implemented in a supplemental line list because they did not have upper vibrational states identification. The HCN archive has been obtained from a combination of experimental and theoretical data. The theoretical data were taken exclusively from the line list of Harris et al. [3]. Experimental data were used in preference to the ab inito data where it were available. The line list covers the spectral region 0.011561-17943 cm-1. Hot bands with a lower vibrational state of 3 quanta of bend, are given for many of the lower energy transitions. Data are included for transitions up to the (5001) stretching combination bands. The HCN line list was constructed in the following stages:
-
Construction of a list of laboratory determined energy levels.
The available laboratory line measurements: Lecoutre et al. [4]; Maki at al. [5,6]; Maki and Mellau [7]; Smith et al. [8-10] for line frequencies, were gathered together. From these line frequency data, a list of HCN energy levels was determined. This was done by using a technique that deviates only slightly from that of Harris et al. [11]; the rotational constants are used to compute energy levels up to an angular momentum quantum number of 60.
-
Construction of a list of laboratory determined line frequencies.
Using the laboratory determined energy levels it is straight forward to compute a list of line frequencies for dipole allowed transitions. The well known selection rules for dipole transitions require a change in symmetry and allow a change in angular momentum of 0, +/- 1. When applied to HCN the allowed transitions form two groups. The first has a change in parity of the vibrational angular momentum with no change in total angular momentum. The second group has no change in the parity of the vibrational angular momentum, but a change of plus or minus one in total angular momentum. For all the dipole allowed transitions between laboratory determined energy levels, line frequencies were computed by subtracting lower state energy from upper state energy.
-
Construction of a list of laboratory determined line strengths.
A list of line strengths were computed from laboratory data (Maki et al. [12,13]; Smith et al. [8-10]). This data is usually given in the form of band strengths or dipoles that are often supplemented with Hermann-Wallis factors. From this data, the line strengths of individual lines were computed by using the relevant Höl-London factor and the equation given by Maki et al. [12].
-
Construction of laboratory determined line list.
The laboratory determined line strengths were inserted into the list of laboratory determined energy levels. In this way, a HCN line lists is created that is based upon laboratory measurements.
-
Augmentation of the laboratory determined line list with ab initio line strengths.
Many of the intensities for the dipole allowed bands have not been measured. The resulting gap in the laboratory determined line list may only be filled by ab initio data.
Many of the transitions in the ab initio line list of Harris et al. [3] have been assigned an approximate vibrational quantum number. We were therefore able to insert the line strengths from the Harris et al. [3] line list into the GEISA 2011 line lists, creating a more complete list of lines.
-
Augmentation with ab initio data and truncation.
The upper and lower energy levels for many strong room temperature lines have not been determined. In order to account for these strong lines the HCN GEISA 2011 line list was augmented with purely ab initio line frequency and intensity data from Harris et al. [3]. Finally, to cut down the size of the final line list, a minimum line intensity of 10-30cm molecule-1 was chosen. Lines with intensities below this level were removed form the final line list.
Maki’s data [2]include the isotopic species: H12C14N, H13C15N and a new one for GEISA 2011, i.e.: D12C14N and comprise 5 files in the spectral ranges: 0.014975-175.672283 cm-1 (408 entries); 533.819433-895.585448 cm-1 (981 entries); 1241.392310-1591.111005 cm-1 (709 entries); 2428.365681-3609.137515 cm–1 (1710 entries) and 452.016228-2725.191923 cm-1) (452 entries) and 452.016228-2725.191923 cm-1 (452 entries) for DCN.
The origin of the spectroscopic parameters is as the following. For:
– Line wavenumber values
The wavenumber values and their uncertainties were based on a large body of data that included many very accurate microwave and mm-wave measurements [14-21] and even more infrared measurements [5,6,22,23]. For each isotopomer all the wavenumber and frequency data were included in a least-squares analysis that made it possible to calculate all the transition wavenumbers, and their uncertainties.
– Intensity values
The Hermann-Wallis-like terms are introduced in the intensity calculation that includes the effects of ι-type resonance. The intensities of the far-infrared transitions are assumed to be well represented by the dipole moment measured for each vibrational state. The best dipole moment measurements are those given by Tomasevich [24] and by DeLeon and Muenter [25] and Ebenstein and Muenter [26]. The dipole moment is very large and any Coriolis-type mixing of intensity with other vibrational states would probably have a very small effect because the vibrational transition moments are small compared to the dipole moment. For that reason it was assumed that the intensities of the far-IR transitions could be calculated by using the same dipole moment for all values of J. The intensities for the ν2 transitions for HCN, H13CN, and HC15N were taken from the work of Devi et al. [27]. The same intensity constants were used for the hot bands that accompany ν2. For transitions that involve ν2 > 1, the effects of l-type resonance were included as described by Maki et al. [12]. The intensities of the 2ν2 band and hot band are based on the measurements of Devi et al. [28] and Maki et al. [12,29]. For these transitions the effects of l-type resonance were taken into account [12,29]. The intensities of the ν1 transitions for HCN, H13CN, and HC15N were taken from the work of Devi et al. [30]. The hot bands were assumed to require the same intensity constants, as was verified by the agreement with the measurements of Devi et al. [30]. For the ν1–ν2 transitions near 2600 cm-1 the intensity constants were taken from the measurements of Maki et al.[12]. The intensities of the ν2+ν3 band near 2800 cm-1 came from the work of Maki et al. [29] and the intensities of the 2ν2+ν3 transitions near 3520 cm-1 were taken from that same work.
– The pressure broadening and pressure shift parameters
Except for the regions 2428-2720 cm-1 and 3089-3450 cm-1, the air induced pressure broadening and the air induced pressure shifts of HCN, and their temperature dependence, were based on the data given by Devi et al. [27] for the ν2 band of HCN. Except for some transitions that did not include states with v1>0, the line parameters for the regions 2428-2720 cm-1 and 3089-3450 cm-1 were based on the measurements by Rinsland et al. [31]. Their earlier work on the 2ν2 and ν1 bands of HCN indicated that, aside from the wavenumbers of the transitions, there is very little vibrational dependence of the various line parameters for HCN. The only parameters that seemed to be dependent on the vibrational state were the air induced shift coefficients and their temperature dependence. In GEISA 2011 those parameters were assumed to have the values given by Rinsland et al. [31] for all transitions with v1 = 1 in the upper state. The air pressure shift parameters for all transitions with v1 = 0 were assumed to be the same as those measured by Devi et al. [27] for ν2. Devi et al. [27,28] believed that the parameters were the same, within experimental error, for both ν2 and for 2ν2 and probably would be the same for the ground state as well. Since GEISA 2011 include transitions involving much higher rotational states, to J = 60, than those measured by Devi et al. [27,28,30] and Rinsland et al. [31], J < 34, the trends in the various line shape parameters were extrapolated beyond reasonable bounds and the uncertainties in the parameters were enlarged to attempt to encompass reasonable values.
All of the broadening and shift parameters for H13C14N and H12C15N were assumed to be the same as for the most common isotopomer, H12C14N. Within experimental error, this assumption was based on a number of measurements made on the 2ν2 band of H13C14N [28].
The air induced pressure shifts for DCN were given values that were 70% of those for HCN in accord with a private communication from Smith [32]. That estimate was not based on any real measurements of DCN but rather was based on the trend shown by HCl and DCl. The other parameters for DCN were the same as for HCN, but again that was not based on any measurements.
The HCN GEISA 2011 line list has been processed as the following: starting from Harris’s line list [1], the Maki’s data have been included [2], replacing the Harris’s ones of common quantum identification.
References
[1] Harris G. Private communication, 2008
[2] Maki A. Private communication, 2008.
[3] Harris GJ, Polyansky OL and Tennyson J. Opacity data for HCN and HNC from a new ab initio linelist. Astrophys J 2002;578: 657-63.
[4] Lecoutre M, Rohart F, Huet TR, Maki AG. Photoacoustic detection of new bands of HCN between 11 390 and 13 028 cm-1.J Mol Spectrosc 2000;203:158-64
[5] Maki A, Quapp W, Klee S, Mellau GCh, Albert S. Infrared transitions of H12C14N and H12C15N between 500 and 10,000 cm-1. J Mol Spectrosc 1996;180:323-36.
[6] Maki AG, Mellau GC, Klee S, Winnewisser M, Quapp W. High temperature infrared measurements in the region of the bending fundamental of H12C14N, H12C15N, and H13C14N. J Mol Spectrosc 2000;202:67-82.
[7] Maki AG, Mellau GC. High-temperature infrared emission measurements on HNC. J Mol Spectrosc 2001;206:47-52.
[8] Smith AM, Jørgensen UG, Lehmann KK. The intensities of HCN overtone transitions from 12600-18400 cm-1. J Chem Phys 1987;87:5649-56.
[9] Smith AM, Coy SL, Klemperer W, Lehmann KK. Fourier transform spectra of overtone bands of HCN from 5400 to 15100 cm-1. J Mol Spectrosc 1989;134:134-53.
[10] Smith AM, Klemperer W, Lehmann KK. The intensity of the 105-000 transition of HCN. J Chem Phys 1989;90: 4633-34.
[11] Harris GJ, Tennyson J, Kaminsky BM, Pavlenko YaV, Jones HRA. Improved HCN/HNC linelist, model atmsospheres synthetic spectra for WZ Cas. Mon Not R astr Soc 2006;367:400-6.
[12] Maki A, Quapp W, Klee S. Intensities of hot-band transitions: HCN hot bands. J Mol Spectrosc 1995;171:420-32.
[13] Maki A, Quapp W, Klee S, Mellau GCh and S. Albert S. b The CN mode of HCN: a comparative study of the variation of the transition dipole and Hermann-Wallis constants for seven isotopomers and the influence of vibration-rotation interaction. J Mol Spectrosc 1995;174:365-78.
[14] Maki AG. Microwave spectra of molecules of astrophysical interest, VI carbonyl sulfide and hydrogen cyanide. J Phys Chem Ref Data 1974;3:221-44.
[15] Preusser J, Maki AG. Millimeter-wave measurements of vibrationally excited states of the HCN isotopomers H13C14N, H12C15N, H13C15N, D12C14N, D13C14N, D12C15N, and D13C15N. J Mol Spectrosc 1993;162:484-97.
[16] Maiwald F, Lewen F, Ahrens V, Beaky M, Gendriesch R, Koroliev AN, Negirev AA, Paveljev DG, Vowinkel B, Winnewisser G. Pure rotational spectrum of HCN in the terahertz region: Use of a new planar Schottky diode multiplier. J Mol Spectrosc 2000;202:166-68.
[17] Thorwirth S, Müller HSP, Lewen F, Brünken S, Ahrens V, Winnewisser G. A concise new look at the l-type spectrum of H12C14N. Astrophys J. (letters) 2003;585:L163-65.
[18] Ahrens V, Lewen F, Takano S, Winnewisser G, Urban S, Negirev AA, Koroliev AN. Sub-Doppler saturation Spectroscopy of HCN up to 1 THz and detection of J=3→2 (4→3) emission from TMC1. Z Naturforsch 2002;57a:669-81.
[19] Zelinger Z, Amano T, Ahrens V, Brünken S, Lewen F, Müller HSP, Winnewisser G. Submillimeter-wave spectroscopy of HCN in excited vibrational states. J Mol Spectrosc 2003;220:223-33.
[20] Brünken S, Fuchs U, Lewen F, Urban S, Giesen T, Winnewisser G. Sub-Doppler and Doppler spectroscopy of DCN isotopomers in the terahertz region: ground and first excited bending states (v1v2v3) = (0 1e,f 0). J Mol Spectrosc 2004;225:152-62.
[21] Cazzoli G, Puzzarini C. The Lamb-dip spectrum of the J+1←J (J = 0, 1, 3-8) transitions of H13CN: The nuclear hyperfine structure due to H, 13C, and 14N. J Mol Spectrosc 2005;233:280-89.
[22] Freund SM, Maki AG. Laser Stark spectroscopy of DCN and DC15N, J Mol Spectrosc 1982;93:433-37.
[23] Möllmann E, Maki AG, Winnewisser M, Winnewisser BP, Quapp W. High-temperature infrared emission spectra of D12C14N and D13C14N. J Mol Spectrosc 2002;212:22-31.
[24] Tomasevich GR. Ph.D thesis, Harvard University, Cambridge, MA, 1970.
[25] DeLeon RJ, Muenter JS. The vibrational dipole moment function of HCN. J Chem Phys 1984;80:3992-99.
[26] Ebenstein WL, Muenter JS. Dipole moment and hyperfine properties of the ground state and the C-H excited vibrational state of HCN. J Chem Phys 1984;80:3989-91
[27] Malathy Devi V, Chris Benner D, Smith MAH, Rinsland CP, Predoi-Cross A, Sharpe SW, Sams RL, Boulet C, Bouanich JP. A Multispectrum analysis of the ν2 band of H12C14N: Part I. Indensities, broadening, and shift coefficients. J Mol Spectrosc 2005;231:66-84.
[28] Malathy Devi V, Chris Benner D, Smith MAH, Rinsland CP, Sharpe SW, Sams RL. A multispectrum analysis of the 2ν2 spectral region of H12C14N: intensities, broadening, and pressure-shift coefficients. JQSRT 2004;87:339-66.
[29] Maki A, Quapp W, Klee S, Mellau GCh, Albert S. Intensity measurements of Δl >1 transitions of several isotopomers of HCN. J Mol Spectrosc 1997;185:356-69.
[30] Malathy Devi V, Chris Benner D, Smith MAH, Rinsland CP, Sharpe SW, Sams RL. A multispectrum analysis of the ν1 band of H12C14N: Part I. Intensities, self-broadening, and self-shift coefficients. JQSRT 2003;82:319-41.
[31] Malathy Devi V, Chris Benner D, Smith MAH, Rinsland CP, Sharpe SW, Sams RL. A multispectrum analysis of the ν1 band of H12C14N: Part II. Air- and N2-broadening, shifts and their temperature dependences. JQSRT 2003;82:343-62.
[32] Smith MAH. Private communication
Author: B. Bézard
The intensities of the ν26 band transitions have been corrected in GEISA 2003 linelist which includes only the cold band. A PNNL spectrum at 298 K yields an intensity of 4.27×10⁻¹⁹ cm molec-1 for the whole band, including cold and hot bands [1], a value that agrees with Giver et al. older measurement (4.33×10⁻¹⁹ cm molec-1) [2]. The vibrational partition function at 296 K is 2.71, so that the intensity of the fundamental cold band should be about 4.27 / 2.71 = 1.58×10⁻¹⁹ cm molec-1. In the GEISA 2003 line-list, an intensity of 3.76×10 19 cm molec-1 had been set for the cold band, based on some low-resolution spectra that includes the hot bands, which is incorrect. The GEISA 2003 intensities have thus been multiplied by a factor of 1.58 / 3.76 = 0.420 in the GEISA 2011 edition.
For all bands, a Lorentz halfwidth of 0.12 cm-1 atm-1 at 296 K and a temperature exponent of 0.50 was assumed for all transitions, following N2-broadening measurements by Nadler and Jennings [3] and Hillman et al. [4].
References
[1] J.-M. Flaud, private communication
[2] Giver LP, Varanasi P and Valero FPJ. Propane absorption band intensities and band model parameters from 680 to 1580 cm-1 at 296 and 200 K. JQSRT 1984;31:203-13.
[3] Nadler S and Jennings DE. Foreign-gas pressure broadening parameters of propane near 748 cm-1. JQSRT 1989;42:399-403.
[4] Hillman JJ, Reuter DC, Jennings DE, and Bjoraker GL. Extraterrestrial spectroscopy: foreign-gas broadening of propane as it applies to the atmosphere of Titan. Spectrochim Acta 1992;48A:1249-55.
Author: B. Bézard
A mistake has been found in the relative intensities of the hot sub-bands of the ν5 band listed in GEISA 2003 (and in previous versions). More precisely, the intensities of the (02)2 ← (02)1, (03)1 ← (02)2 and (03)3 ← (02)2 sub-bands were twice too large; they have been corrected accordingly, in GEISA 2011. Following this correction, the total band intensity has been updated by multiplying all line intensities by 0.95, a factor that yields the best agreement with Grecu et al. [1] absolute intensity measurements in the (01)1 ← (00)0 cold band, as listed in Table III (data for 8 mbar of N2 pressure) of Ref. [1]. Note that this determination slightly disagrees with the older measurement of the integrated band intensity by Kim and King [2], which would yield intensities 15% larger. For the Lorentz broadening parameter (HWHM), we used the expression ‘0.12 – 0.00035 m‘ at 296 K, derived from a fit of the data points in Fig. 5 of Grecu et al. [3]. We arbitrarily assumed a temperature exponent of 0.75 for all GEISA 2011 transitions.
References
[1] Grecu JC, Winnewisser BP, and M. Winewisser M. Absolute rovibrational line intensities in the ν5 band system of cyanogen NCCN. J Mol Spectrosc 1993;159:551-71.
[2] Kim K and and King WTJ. Integrated infrared intensities in cyanogens. J Chem Phys 1984;80:974-77.
[3] Grecu JC, Winnewisser BP, and M. Winewisser M. High-resolution Fourier transform infrared spectrum of the ν5 band system of cyanogen, NCCN. J Mol Spectrosc 1993;159;534-50.
Authors: A. Jolly,Y. Bénilan, A. Fayt
The diacetylene line list of GEISA 2003 (issued 1982) has been replaced in GEISA 2011 by a new line list based on experimental and theoretical studies by Jolly et al. 2009 (in preparation) [1]. Included lines belong to the ν8 and ν9 bands respectively in the range between 581-730 cm-1 and 191-257 cm-1. The number of lines has been increased from 1405 to 119480 lines compared to the previous GEISA 2003 line list. Due to low energy vibrational modes, the vibrational partition function of C4H2 is large (Qv = 3.61 at 300 K). This means that only 28 % of the molecules are in the ground state at room temperature. In the previous GEISA 2003 line list, hot band transitions from three different excited levels were present in the ν9 band complex but none in the strong ν8 band complex. The new line list includes hot band transitions with lower vibrational levels up to about 1300 cm-1 for the ν8 band complex and up to about 900 cm-1 for the weaker ν9 band. This was necessary to take into account the contribution of all the hot band transitions with a non negligible intensity at room temperature. The minimum intensity of the lines is 3.10-24 (cm2/molecule cm-1 at 296 K). It was also necessary to extend the quantum identification, in particular the vibrational quantum numbers of both upper and lower levels. All v values for the nine vibration modes of C4H2 have been included in the assignment together with the four ι values corresponding to all bending modes (v-1, v2, v3, v4, v5, v6, v7, v8, v9, ι6, ι7, ι8, ι9). The new line list is based on a global analysis study as described by Fayt and collaborators [2]. High resolution data from Arié et al.[3] where fitted together with other experimental data in the infrared [4,5] and in the microwave domain [6]. Since no new intensity measurements were available, band intensity measurements by Koops and colleagues [7] were chosen to infer the absolute intensities of the lines.
The improvement of the data is very important in particular for the study of planetary atmospheres. Diacetylene has first been detected in Titan?s atmosphere by the IRIS spectrograph on board the Voyager spacecraft [8] and is now under close scrutiny by the CIRS spectrometer on board CASSINI [9]. Recently detection occurred in the atmosphere of Uranus and Neptune using the Spitzer space telescope [10,11]. Outside the solar system, the detection of diacetylene was possible in the post-AGB object CRL2688 and in the proto-planetary nebulae CRL618 [12]. All detections so far where obtained thanks to the strong ν8 bending mode centered at 628 cm-1 but the weaker ν9 bending mode at 220 cm-1 was also detected by IRIS and CIRS in Titan’s atmosphere.
References
[1] Jolly, AB, Bénilan Y, Fayt, A. New line list for the bending modes of diacetylene. 2009. In preparation.
[2] Fayt A, Vigouroux C, Willaert F, Margules L, Constantin F-L, Demaison J, Pawelke G, Mkadmi ElB, Bürger H. Global analysis of high resolution infrared and rotational spectra of HCCC15N up to 1335 cm-1. J Molec Struct 2004;695-696:295-311.
[3] Arié E and Johns JWC. The bending energy levels of C4H2. J Mol Spectrosc 1992;155:195-204.
[4] Guelachvili G, Craig AM and Ramsay DA. High-Resolution Fourier studies of diacetylene in the regions of the nu4 and nu5 fundamentals. J Mol. Spectrosc 1984;105:156-92.
[5] McNaughton D, Bruget DN. The high resolution infrared spectrum of diacetylene. J Molec Struct 1992;273:11-25.
[6] Matsumura K, Etoh T and Tanaka T. Microwave spectroscopy of the n8-n6 band of diacetylene. J. Mol. Spectrosc 1981;90:106-15.
[7] Koops T, Visser T and Smit WMA. The harmonic force field and absolute infrared intensities of diacetylene. J Molec. Struct 1984;125:179-96.
[8] Kunde V.G, Aikin AC, Hanel RA, Jennings DE, Maguire WC, Samuelson RE. C4H2, HC3N and C2N2 in Titan’s Atmosphere. Nature 1981;292:686-88.
[9] Coustenis A, Achterberg RK, Conrath BJ, Jennings DE, Marten A, Gautier D; Nixon CA, Flasar FM, Teanby NA, Bézard B, Samuelson RE, Carlson RC, Lellouch E, Bjoraker GL, Romani PN, Taylor FW, Irwin PG, Fouchet T, Hubert A, Orton GS, Kunde VG, Vinatier S, Mondellini J, Abbas MM, Courtin R. The composition of Titan’s stratosphere from Cassini/CIRS mid-infrared spectra. Icarus 2007;189:35-62.
[10] Burgdorf MJ, Orton GS, Van Cleve J, Meadows VS, Houck J. Detection of new hydrocarbons in Uranus’atmosphere by infrared spectroscopy. Icarus 2006;184:634-37.
[11] Meadows VS, Orton GS, Line M, Liang M-C, Yung YL, Van Cleve J, Burgdorf MJ. First Spitzer observations of Neptune: Detection of new hydrocarbons. Icarus, 2008;197: 585-89.
[12] Cernicharo J, Heras A, Pardo J, Tielens A, Guelin M, Dartois E, Neri R and Waters L. Methylpolyynes and Small Hydrocarbons in CRL 618. Astrophys J 2001;546:127-30.
Authors: Jolly A., Bénilan Y., Fayt A.
A line list of cyanoacetylene is present in GEISA since 1982 thanks to Goldman (private communication). It has already been modified in 1990 following a new analysis by Ariè and coworkers [1]. In GEISA 2011, a completely new line list based on experimental and theoretical studies by Jolly et al.[2] is replacing the previous version. Included lines belong to the ν5 and ν6 band in the range between 463 and 760 cm-1. The number of lines has increased from 2027 lines in the 1990 version to more than 179347 lines in the present version. This considerable increase was necessary to take into account all hot band transitions with a minimum intensity of 10-24 (cm2/molecule cm-1 at 296 K). Transitions with lower vibrational levels up to about 1500 cm-1 had to be included to take into account all the intensity of the bands. In the previous line list only few lines belonging to hot band transitions where included [2]. To obtain this new line list, a global analysis was performed fitting simultaneously high resolution data from Arié et al.[1] together with all available experimental data including microwave and infrared measurements. As a result, positions and relative intensities of lines belonging to 123 excited substates could be obtained. As for C4H2, the assignment code needed to be modified to take into account levels with high vibrational quanta numbers (v, ι). HC3N possess four stretching and three bending modes. A complete vibrational assignment includes all seven v values and three ι values (v-1, v2, v3, v4, v5, v6, v7, ι5, ι6, ι7). The absolute intensities of the lines have been derived by a new measurement of the integrated band intensities of ν5 and ν6 at 0.5 cm-1 resolution as described in Jolly et al. 2007 [2].
Cyanoacetylene is a molecule of great interest for planetary atmosphere and in particular for Titan’s atmosphere where it has been detected by IRIS during the Voyager mission [3]. The presence of HC3N was confirmed by the ISO space telescope [4] and is observed in details since 2004 by the CIRS spectrometer on board the CASSINI spacecraft. The quality of the new observations by CIRS has improved a lot in terms of spectral and spatial resolution compared to previous observations. Very recently, Jennings and colleagues [5] used the new line list proposed by Jolly and coworkers [2] to obtain a good fit of the HC3N feature at 663 cm-1 in Titan’s spectra. The contribution of hot bands where clearly observed as a large shoulder on the high energy side of the main feature. The quality of the fit enabled to detect small contributions due to 13C isotopologues of HC3N which were detected for the first time in the solar system. The contribution of hot bands in such a cold environment as Titan’s atmosphere is not surprising knowing that the partition function is equal to 1.69 at 200 K which means that about 40 % of the molecules are still in an excited state.
References
[1] Arie E, Dang Nhu M, Arcas Ph, Graner G, Bürger H, Pawelke G, Khlifi M, Raulin F. Analysis of Cyanoacetylene spectra in the mid-infrared. J Mol Spectrosc 1990;143:318-26.
[2] Jolly A, Benilan Y and Fayt A. New infrared integrated band intensities for HC3N and extensive line list for the ν5 and ν 6 bending modes. J Mol. Spectrosc 2007;242:46-54.
[3] Kunde VG, Aikin AC, Hanel RA, Jennings DE, Maguire WC, Samuelson RE. C4H2, HC3N and C2N2 in Titan’s Atmosphere. Nature 1981;292:686-88.
[4] Coustenis A, Salama A, Schulz B, Ott S, Lellouch E, Encrenaz T, Gautier D and Feuchtgruber H. Titan’s atmosphere from ISO mid-infrared spectroscopy. Icarus 2003;161:383-403.
[5] Jennings DE, Nixon CA, Jolly A, Bézard B, Coustenis A, Vinatier S, Irwin PGJ, Teanby NA, Romani PN, Achterberg RK and Flasar FM. Isotopic Ratios in Titan’s Atmosphere from Cassini CIRS Limb Sounding: HC3N in the North. Astrophys Jl 2008;681:L109-L111.
HOCl (molecule 32)
No update for this molecule since the GEISA 2003 Edition.
Reference
Jacquinet-Husson N, Scott NA, Chédin A, Crépeau L, Armante R, Capelle V et al. The GEISA spectroscopic database: Current and future archive for Earth and planetary atmosphere studies. JQSRT 2008;109:1043-59.
The whole of the line parameters of N2 has been replaced by a new line list provided by Goldman [1]. Improvements to the line parameters mainly include intensities and half-widths. The new intensities are obtained by the use of two works: the work by Goldman et al. [2], where a semi-empirical Herman-Wallis formulation of the vibration-rotation effects on the intensities associated with a final scaling based on observed spectra, and the work by Li and Le Roy [3] based on ab initio methods. Values derived by both, Goldman et al. [2] and Li and Le Roy [3], methods are very similar. However, the ab initio matrix elements of Ref. [3] have been adopted for the GEISA 2011 line list, because it can be expected that the Herman-Wallis formulation of Goldman et al. yields less accurate values with increasing J. Presently, the GEISA N2 list is restricted to only the the(1-0) N2 band. It should be noted that Li and Le Roy [3] method makes it possible to derive additional line parameters for other bands that may be of atmospheric importance. The absolute accuracy of the Li and Le Roy intensities is estimated of about 1% by the authors; these new values are still being validated. As described in Ref. 2, the new half-widths are based on available experimental and theoretical studies. As stated in Ref. [2], further extensions are expected in the near future.
References
[1] Goldman A. Denver University, USA, private communication, 2008.
[2] Goldman A, Tipping RH, Ma Q, Boone CD, Bernath PF, Demoulin P, et al. On the line parameters for the X1Sg+ (1-0) infrared quadrupolar transitions of 14N2. JQSRT 2007;103:168-74.
[3] Li H, Le Roy RJ. Quadrupole moment function and absolute infrared quadrupolar intensities for N2J Chem Phys 2007;126:4301.
The former GEISA 2003 line list [1] for this molecule, based on Ref. [2], has only been revised thanks to data from Ref. [3]. In particular, the 2ν3 identification has been attributed to previous unassigned vibrational transitions and the self-broadened half-widths have been revised as well, for both isotopes. The total number of transitions (18,344) has not been altered since the GEISA 2003 edition.
References
[1] Jacquinet-Husson N, Scott NA, Chédin A, Crépeau L, Armante R, Capelle V et al. The GEISA spectroscopic database: Current and future archive for Earth and planetary atmosphere studies. JQSRT 2008;109:1043-59.
[2] Chackerian C, Brown LR, Lacome N, Tarrago G. Methyl chloride n5 region line shape parameters and rotational constants for the ν2, ν5 and 2ν3 vibrational bands. J Mol Spectrosc 1998;191:148-57.
[3] Brown LR. Jet Propulsion Laboratory, USA, private communication, 2007.
Authors: A. Perrin and J.M. Flaud
The H2O2 (hydrogen peroxide) data previously archived in GEISA 2003 for the μ6 band in the 7.9-μm region have been completely replaced, leading to improved line positions and intensities in GEISA 2011. Indeed, this new list is more complete as it includes several hot torsional-vibration sub-bands of the ν6 band (up to the n=2 torsional quantum number), instead of only the two main torsional components of the ν6 band (in the n= 0, τ = 1 and n= 0, τ = 3 torsional quantum numbers). In addition the new line positions are more accurate since the vibration- torsion- rotation coupling the energy levels from the 6-1 state with those from the 2-1, 31 and ground vibrational states were accounted for. The line intensities are also more accurate as these parameters are based on new line intensity measurements and on a sophisticated theoretical treatment which account for the torsional effects.
The sources of the new data are Refs. [1,2].
References
[1] Perrin A, Valentin A, Flaud JM, Camy-Peyret C, Schriver L, Schriver A, Arcas Ph. The 7.9-μm Band of Hydrogen peroxide: Line Positions and Intensities. J Mol Spectrosc 1995;171:358-73.
[2] Klee S, Winnewisser M, Perrin A, Flaud JM. Absolute Line Intensities for the n6 Band of H2O2. J Mol Spectrosc 1999;195:154-61.
No new line list has been implemented in GEISA 2011 for hydrogen sulphide, but updates occurred for air- and self- broadened pressure half-widths. When available, measured values have been adopted, i.e.: -those from Sumpf et al. [1], Kissel et al. [2,3] and Waschull et al. [4], for air-broadened half-widths; -those from Refs. [1,4] and from Sumpf [5] for self-broadened half-widths. Otherwise, default values of 0.074 and 0.1580 have been assigned to air- and self- broadened half-widths, respectively. These values have been obtained as averages of the previous quoted reference ones.
References
[1] Sumpf B, Meusel I, Kronfeldt HD. Self- and air-broadening in the ν-1 and ν3 bands of H2S. J Mol Spectrosc 1996;177:143:5.
[2] Kissel A, Kurtz O, Kronfeldt HD, Sumpf B. Quantum number and perturber dependence of pressure-induced line shift and line broadening in the 2ν2, ν-1, and ν3 bands of H2S. 15th International Conference on High Resolution Molecular Spectroscopy, Prague, Czech Republic, August 30-September 3, 1998.
[3] Kissel A, Sumpf B, Kronfeldt HD, Tikhomirov BA, Ponomarev YN. Molecular-gas-pressure-induced line-shift and line-broadening in the ν2-band of H2S. J Mol Spectrosc 2002;216:345-54.
Waschull J, Kuhnemann F, Sumpf B. Self-, air- and helium broadening of the ν2 band of H2S. J Mol Spectrosc 1994;165:150-8.
[4] Sumpf B. Experimental investigation of the self-broadening coefficients in the ν-1+ν3 band of SO2 and the 2ν2 band of H2S. J Mol Spectrosc 1997;181:160:7.
Authors: J. Vander Auwera and A. Perrin
This new 2011 edition of GEISA corresponds to a complete replacement and enhancement of the spectroscopic information provided for formic acid. Indeed, until GEISA 2003 [1], only parameters for 3388 lines of the ν6 band of trans-H12C16O16OH near 9 μm were available. They originated from the work of Goldman and Gillis [2]. The sum of the line intensities was equal to 1.757x10⁻¹⁷ cm-1/(molecule cm-2) at 296 K, determined using a Fourier transform laboratory spectrum recorded at the University of Denver [2].
GEISA 2011 provides spectroscopic information for trans-H12C16O16OH in three spectral regions: the pure rotation spectrum in the far infrared, the ν6 and ν8 bands near 9 μm, and the ν3 band around 5.6 μm.
Far-infrared Fourier transform spectra of the pure rotation spectrum of formic acid were recorded in the range from 20 to 130 cm-1 and analyzed by Vander Auwera [3]. To provide an accurate set of parameters describing the rotational structure of the ground state of trans-H12C16O16OH, 592 far-infrared line positions were fitted together with 372 microwave lines [4,5,6]. The resulting constants and know dipole moment [7] were then used to calculate the positions, intensities and lower state energies of 6808 a– and b-type pure rotation lines observed between 10 and 100 cm-1, originating from J/Ka levels ranging from 0/0 to 70/17, corresponding to ΔKa = 0, +/-1 and ΔKc = +/-1, +/-3, and being stronger than 4.0x10⁻²⁶ cm-1/(molecule cm-2) at 296 K. The line positions have been substantiated by a study of Winnewisser et al. [8]. Note that the intensities listed in GEISA 2011 are a factor 4 larger than those listed in Table II of [3], because of the oversight of the nuclear spin degeneracy of the hydrogens in the latter. To complement these data, the self- and air-broadening parameters, and temperature dependence exponent of the air-broadening parameter of all the lines were set to the same values as applied to the ν6 and ν8 bands (see here below).
The 9 μm spectral region was updated according to the recent work by Vander Auwera et al. [9]. They reported absolute line intensities measurements for the ν6 and ν8 bands using Fourier transform spectroscopy, taking the existing dimer (HCOOH)2 into account in the analysis. They showed that the intensities reported by Goldman and Gillis [2], and therefore in GEISA 2003, were a factor of about 2 lower than the average of the other existing laboratory measurements, and than theoretical calculations. Relying on results of that work, Perrin and Vander Auwera [10] generated a new set of 49625 line positions, intensities and lower state energies covering the range from 940.20 to 1244.41 cm-1. To complete these data, the self- and air-broadening parameters, and the temperature dependence exponent of the air-broadening parameter of all the lines were set to 0.32 cm-1atm-1 [9], 0.101 cm-1atm-1 [11] at 296 K, and n = 0.75, respectively. With a sum of the line intensities equal to 3.51x10⁻¹⁷ cm-1/(molecule cm-2) at 296 K and a threefold increase of the wavenumber coverage, this new list was shown to provide a significantly improved modeling of the ν6 spectral region of formic acid [10].
Using high-resolution Fourier transform spectra of trans-HCOOH recorded at 5.6 μm, Perrin et al [12] carried out an extensive analysis of the strong ν3 fundamental band at 1776.83 cm-1, starting from results of a previous analysis [7]. As pointed out in the literature, the ν3 band is significantly perturbed by resonances with numerous dark bands. Perrin et al. [12] were able to assign series belonging to the ν5+ν7, ν5+ν9, ν6+ν7 and ν6+ν9 dark bands, located at 1843.48, 1792.63, 1737.96 and 1726.40 cm-1 respectively. The model used to calculate energy levels accounted partly for the observed resonances, and reproduced most of the observed line positions, within experimental uncertainties. Absolute line intensities were also determined in that work with an accuracy estimated to 15% [12]. From these results, the first database for the 5.6 μm region of the formic acid spectrum was built. It includes 6251 lines belonging to the ν3, ν5+ν7, ν5+ν9, ν6+ν7 and ν6+ν9 bands of trans-H12C16O16OH with J ≤ 66, Ka ≤ 18, and lower and upper states energies up to 2700 and 3600 cm-1, respectively. Table 6 of [12] details the contents of the line list.
References
[1] Jacquinet-Husson N, Scott NA, Chédin A, Crépeau L, Armante R, Capelle V et al. The GEISA spectroscopic database: Current and future archive for Earth and planetary atmosphere studies. JQSRT 2008;109:1043-59.
[2] Goldman A, Gillis JR. Line parameters and line calculation for molecules of stratospheric interest. Technical Report, Dept of Physics, University of Denver, 1984.
[3] Vander Auwera J. High-resolution investigation of the far-infrared spectrum of formic acid. J Mol Spectrosc 1992;155:136-42.
[4] Willemot E, Dangoisse D, Monnanteuil N, Bellet J. Microwave spectra of molecules of astrophysical interest. XVIII. Formic acid. J Phys Chem Ref Data 1980;9:59-160.
[5] Chardon JC, Genty C, Guichon D, Theobald JG. RF spectrum and hyperfine structure of formic acid. J Chem Phys 1976;64:1437-41.
[6] Belov SP, Buranin AV, Kazarov VP, Karyakin EN, Krupnov AF. Microwave gas spectroscopy in the 200-870 GHz range. JETP Lett Engl Transl 1973;18:167-9.
[7] Weber WH, Maker PD, Johns JWC, Weinberg E. Sub-Doppler laser-Stark and high-resolution Fourier transform spectroscopy of the μ3 band of formic acid. J Mol Spectrosc 1987;121:243-60.
[8] Winnewisser M, Winnewisser BP, Stein M, Birk M, Wagner G, Winnewisser G, Yamada KMT, Belov SP, Baskakov OI. Rotational spectra of cis-HCOOH, trans-HCOOH, and trans-H13COOH. J Mol Spectrosc 2002;216:259-65.
[9] Vander Auwera J, Didriche K, Perrin A, Keller F. Absolute line intensities for formic acid and dissociation constant of the dimer. J Chem Phys 2007;126:124311/1-9.
[10] Perrin A, Vander Auwera J. An improved database for the 9 μm region of the formic acid spectrum. JQSRT 2007;108:363-70.
[11] Notholt J, Cappellani F, Roesdahl H, Restelli G. Absolute infrared band intensities and air broadening coefficient for spectroscopic measurements of formic acid in air. Spectrochim Acta Part A 1991;47:477-83.
[12] Perrin A, Vander Auwera J, Zelinger Z. High-resolution Fourier transform study of the μ3 fundamental band of trans-formic acid. JQSRT 2009;110:743-55.
COF2 (molecule 38)
No update for this molecule since the GEISA 2003 Edition.
Reference
Jacquinet-Husson N, Scott NA, Chédin A, Crépeau L, Armante R, Capelle V et al. The GEISA spectroscopic database: Current and future archive for Earth and planetary atmosphere studies. JQSRT 2008;109:1043-59.
Author: V. Boudon
Sulfur hexafluoride is a strong greenhouse gas whose concentration in the atmosphere should be monitored and limited, according to the Kyoto protocol [1]. SF6 spectroscopy is, however, quite badly known (at least for atmospheric purposes). The main reason is that this molecule is heavy, which has two important consequences on its spectrum: i) there are low-lying bending vibrational modes producing a lot of hot bands and ii) the spectrum is very dens so that even at high resolution there is virtually no isolated line, each line being a cluster of many overlapping transitions. The second point renders the determination of line intensities and, thus, of dipole moment derivatives, very difficult.
Although at lot of work remains to be done on this molecule, many vibrational bands have been investigated in the past years in the Dijon group [2]. A new line list for the v3 stretching and the v4 bending fundamental regions has been produced. The only partial knowledge of the inactive v 6 lowest fundamental still prevents a full hot band analysis, especially for v3 + v6 – v6. However, the lower spectral density in the v4 region has allowed to investigate v4 + v6 – v6 in detail [3]. In the case of v3 itself, which is the strongest absorption band, a very detailed line position analysis exists, based on various high-precision experimental data (FTIR but also saturated absorption and IR-IR double resonance). In this case, the resulting accuracy for line positions is estimated to be better than 0.001 cm-1 up to J = 100. For the v4 fundamental, the accuracy for line positions is around 0.001 cm-1 up to J = 100 and for the v4 + v6 – v6 hot band it is ca. 0.002 cm-1 up to J = 65. The J values given above correspond to the highest values for the assigned lines. The accuracy may decrease quickly when extrapolating to higher J values, although this is difficult to estimate in a quantitative manner.
As mentioned above, the question of line intensities in the case of SF6 is a difficult problem. To generate the present list, we used the best-known dipole moment derivative values found in the literature [4,5]. We checked with the previous list for v3 from GEISA 2003 that we obtain exactly the same intensities in this case. However, we globally estimate the line intensity accuracy to be no better than 20 %, in the absence of precise intensity measurements on isolated lines.
Analyses and calculations have been performed with the Highly-Spherical Top Data System (HTDS) software [6]. The University of Burgundy original whole line list comprised a total amount of 30,106,484 entries. It has been reasonably reduced, applying intensity cutoff in suitability with SF6 impact signatures in most atmospheric radiative transfer calculation results. The applied intensity cut-off, in cm-1/(molecule cm-2) at 296 K, had the value 10-24 for band v3 (46,031 lines retained among 2,826,164 in the original list) and 10-23 for bands v4 (10,986 lines retained among 2,657,543) and v4+v6 – v6 (35,381 lines retained among 24,622,777). As a consequence, the new line list for SF6 in GEISA 2011 (spectral range 580 to 996 cm-1) contains a total reduced to 92,398 lines. For the whole line list, a default value of 0.50 cm-1atm-1 has been given to the air broadening pressure half-widths and of 0.65 to the associated temperature dependence coefficient n.
References
[1] Geller LS, Elkins JW, Lobert JM, Clarke AD, Hurst DF, Butler JH, Myers RC. Tropospheric SF6: Observed latitudinal distribution and trends, derived emissions and interhemispheric exchange time. Geophys Res Lett 1997;24 :675-78.
[2] Boudon V, Pierre G. Rovibrational Spectroscopy of Sulphur Hexafluoride: A Review. Recent Research Developments in Molecular Spectroscopy, S. G. Pandalai Editor, vol. 1, pp 25-55, Transworld Research Network (Trivandrum, India), 2002. ISBN : 81-7895-026-X.
[3] Boudon V, Pierre G, Burger H. High Resolution Spectroscopy and Analysis of the ν4 Bending Region of SF6 Near 615 cm-1. J Mol Spectrosc 2001;205:304-11.
[4] Kim KC, Person WB, Seitz D, Krohn BJ. Analysis of the ν4 (615 cm-1) region of the Fourier transform and diode laser spectra of SF6. J Mol Spectrosc 1979;76:322-40.
[5] Person WB, Krohn BJ. Coriolis intensity perturbations of the ν4 band of SF6. J Mol Spectrosc 1983;98:229-57.
[6] Wenger Ch, Boudon V, Champion JP, Pierre G. Highly-Spherical Top Data System (HTDS) Software for the Spectrum Simulation of Octahedral XY6 Molecules. JQSRT 2000;66(1):1-16. See also: http://icb.u-bourgogne.fr/OMR/SMA/SHTDS.
Author: A. Coustenis
Line parameters for two CH3C2H bands (the ν10 at 331 cm-1 and the ν9 at 639 cm-1) were provided by G. Graner (private communication), based on constants of Pekkala et al. [1] for the frequency calculations and Blanquet et al. [2] for intensities of individual lines. For the n10 band, the study of a first spectrum at a resolution of 0.0056 cm-1 by Horneman et al. [3] was followed by the analysis of a 0.002 cm-1 resolution spectrum by Graner and Wagner (1990). The description of the ν10 was accomplished and, in addition, two main hot bands were also provided (Graner and Wagner [4] 1990; Pekkala et al. [1]). In the 16µm region, the ν9 fundamental band was recorded at 0.003 cm-1 resolution and a full analysis was completed (Pekkala et al. [1]; Pekkala [5].
The extraction of intensities from these high resolution spectra was hindered. As a consequence, global intensities from the literature were used to predict individual line intensities, as explained by Horneman et al. [3].
This dataset was first applied to Titan in Coustenis et al. [6]; see there figure 11a. Both propyne bands were detected on Titan and the more accurate spectroscopic parameters presented in this version of GEISA (updated for the first time since GEISA 1992) allow for a better determination of the molecule abundance since it can now be separated from the nearby C4H2 band (Coustenis et al. [7]).
References
[1] Pekkala K, Graner G, Wlodarczak G, Demaison J, Koput J. A global treatment of the ν9 = 1 and ν10 = 2 vibrational levels of propyne. J Mol Spectrosc 1991;149:214-29.
[2] Blanquet G,Walrand J, Dang-Nhu M, 1992. Absolute line intensities of the ν9 band of propyne at 15.5 µm. Spectrochim Acta A 1992;48:1231-33.
[3] Horneman V-M, Graner G, Fakour H and Tarrago G. Propyne at 30 µm. A Line by Line Simulation of the ν10 Band. J Mol Spectrosc 1989;137:1-8.
[4] Graner G and Wagner G High-resolution infrared spectrum of propyne: The 30 µm region. J Mol Spectrosc 1990;144:389-415.
[5] Pekkala K. The ν9 band of propyne. J Mol Spectrosc 1990;139:377-404
[6] Coustenis A, Encrenaz Th, Bézard B, Bjoraker GL, Graner G, Dang-Nhu M, Arié E. Modeling Titan’s thermal infrared spectrum for high-resolution space observations. Icarus 1993;102:240-60.
[7] Coustenis A, Achterberg R, Conrath B, Jennings D, Marten A, Gautier D, Bjoraker G, Nixon C. Romani P, Carlson R, Flasar M, Samuelson RE, Teanby N, Irwin P, Bézard B, Orton G, Kunde V, Abbas M, Courtin R, Fouchet Th, Hubert A, Lellouch E, Mondellini J, Taylor FW, Vinatier S, 2007. The composition of Titan’s stratosphere from Cassini/CIRS mid-infrared spectra. Icarus 2007;189:35-62.
HO2 (molecule 41)
No new data for this molecule. A technical error in the GEISA 2003 rotational quantum identification has been corrected in GEISA 2011.
References
Jacquinet-Husson N, Scott NA, Chédin A, Crépeau L, Armante R, Capelle V et al. The GEISA spectroscopic database: Current and future archive for Earth and planetary atmosphere studies. JQSRT 2008;109:1043-59.
The rotational transitions from 0-84 cm-1 for the ground and σ9=1 vibrational states have been updated. The predicted transitions for each isotopologue are based on the spectroscopic constants derived from the analyses of millimeter and submillimeter wave rotational spectra in Ref. [1-3]. All predictions were made using SPCAT [4] for a temperature of 296 K. From Ref. [5], isotopic abundances of 0.74957 and 0.23969 and rotational partition functions of 4788362 and 4910202 were used in the predictions for the 35 and 37 chlorine isotopologues, respectively. A vibrational partition function of 4.02 [6] was used that includes the σ9 vibrational mode that has a band origin near 121 cm-1. Future updates will include the simulation of the σ6 fundamental band and the first two associated hot bands for each isotopologue in the 22 µm region.
References
[1] Butler RAH, Petkie DT, Helminger P, De Lucia FC, Bialkowska-Jaworska E and Kisiel Z,. The millimeter-wave spectrum of chlorine nitrate (ClONO2): The σ6 vibrational state. J Mol Spectrosc 2007;244:113-16.
[2] Butler RAH, Petkie DT, Helminger P, De Lucia FC and Kisiel Z. The rotational spectrum of chlorine nitrate (ClONO2): The σ5/σ6σ9 dyad. J Mol Spectrosc 2007; 243:1-9.
[3] Muller HSP, Helminger P and Young SH. Millimeter and Submillimeter Spectroscopy of Chlorine Nitrate: The Cl Quadrupole Tensor and the Harmonic Force Field. J Mol Spectrosc 1997;181:363-78.
[4] Pickett HM, Poynter RL, Cohen EA, Delitsky ML, Pearson JC and Muller HSP. Submillimeter, Millimeter and Microwave Spectral Line Catalog. JQSRT 1998;60:883-90.
[5] Simeckova M, Jacquemart D, Rothman LS, Gamache RR and Goldman A. Einstein A-coefficients and statistical weights for molecular absorption transitions in the HITRAN database. JQSRT 2006;98:130-55.
[6] Goldman A, Gamache RR, Perrin A, Flaud JM, Rinsland CP and Rothman LS. HITRAN partition functions and weighted transition-moments squared. JQSRT 2000;66:455-86.
CH3Br (molecule 43) new molecular species in GEISA 2011
Authors : D. Jacquemart, N. Lacome, F. Kwabia Tchana
CH3Br contributes significantly to ozone depletion since it is dissociated by UV radiation producing Br radicals who catalyze the destruction of ozone [1]. This molecule is the major contributor to bromine in the stratosphere and the main organobromide in the lower atmosphere. The bromine atoms are 50-60 times more destructive of ozone than the chlorine atoms coming from the chlorofluorocarbons compounds (CFCs) [2].
Methyl bromide spectroscopic line parameters are present for the first time in the GEISA 2011 issue. Two line lists of both isotopologues have been generated, one around 10 μm for the ν6 band [3], and the other around 7 μm for the interacting ν2 and ν5 bands [3-5]. In natural abundances, methyl bromide is composed of 50.54% of CH379Br and 49.46% of CH381Br. Note that the broadening coefficients and its temperature dependence obtained in [3,4] around 10μm have been used for the 7-μm spectral region. Air-broadening coefficients have been deduced from nitrogen-broadening coefficients using a constant scaling as for the H2O molecule, for which air-broadening coefficients could be obtained by multiplying N2-broadening coefficients by the value 0.9 as suggested in Refs. [7-9]. Because CH3Br is similar to CH3Cl, we proposed to use the ratio ![]() /
/![]() = 0.96 in order to convert the N2-broadening to the air-broadening. This value comes from the ratio
= 0.96 in order to convert the N2-broadening to the air-broadening. This value comes from the ratio ![]() /
/![]() = 1.25 obtained by averaging measurements of CH3Cl from Refs. [10,11]. Note that this result is quite similar than what has been proposed for ozone in Ref. [12]. This procedure, although approximate since
= 1.25 obtained by averaging measurements of CH3Cl from Refs. [10,11]. Note that this result is quite similar than what has been proposed for ozone in Ref. [12]. This procedure, although approximate since ![]() /
/![]() varies from line to line, is expected to be precise within a few percent which is sufficient in view of the experimental uncertainties and the accuracy of the calculations. Also, the air-width temperature dependence has been added in both spectral regions, using the same values as those obtained for the N2-width temperature dependence (see Eq. (5) and text in Ref. [4]). Accuracies or details for the line parameter calculation can be found in Refs. [4-6]. In absence of experimental or theoretical results for air-pressure shifts for CH3Br, the default value of 0 cm-1.atm-1 have used for all transitions. Note also that line mixing effects have been observed and modelled in the strong Q-branches between 220 and 300 K [13,14]. Line mixing parameters (for direct calculation or Rosenkranz profile [15]) are available upon request to the authors.
varies from line to line, is expected to be precise within a few percent which is sufficient in view of the experimental uncertainties and the accuracy of the calculations. Also, the air-width temperature dependence has been added in both spectral regions, using the same values as those obtained for the N2-width temperature dependence (see Eq. (5) and text in Ref. [4]). Accuracies or details for the line parameter calculation can be found in Refs. [4-6]. In absence of experimental or theoretical results for air-pressure shifts for CH3Br, the default value of 0 cm-1.atm-1 have used for all transitions. Note also that line mixing effects have been observed and modelled in the strong Q-branches between 220 and 300 K [13,14]. Line mixing parameters (for direct calculation or Rosenkranz profile [15]) are available upon request to the authors.
References
[1] McElroy MB, Salawitch RJ, Wofsy SC, Logan JA. Reductions of Atlantic ozone due to synergistic interactions of chlorine and bromine. Lett to Nature (1986); 321: 759-62.
[2] Kurylo MJ, Rodriguez JM. Short-Lived Ozone-Related Compounds. WMO Scientific Assessment of Ozone Depletion: 1998 (1999).
[3] Jacquemart D, Kwabia Tchana F, Lacome N, Kleiner I. A complete set of line parameters for CH3Br in the 10–μm spectral region. JQSRT 2007;105:264-302.
[4] Jacquemart D, Tran H. Temperature dependence of self- and N2-broadening coefficients for CH3Br in the 10–μm spectral region. JQSRT 2008;109:569-79.
[5] Kwabia Tchana F, Kleiner I, Orphal J, Lacome N, Bouba O. New analysis of the Coriolis-interacting ν2 and ν5 bands of CH379Br and CH381Br. J Mol Spectrosc 2004;228:441-52.
[6] Kwabia Tchana F, Jacquemart D, Lacome N, Kleiner I, Orphal J. Absolute line intensities in methyl bromide: The 7-μm region. J Mol Spectrosc 2006;235:132-43.
[7] Benedict WS, Kaplan LD. Calculation of line widths in H2O-H2O and H2O-O2 collisions. JQSRT 1964;4:453-69.
[8] Toth RA, Brown LR. Oxygen broadening parameters of water vapour: 1212-2136 cm-1. J Mol Spectrosc 2003;218;133-50.
[9] Rothman LS, Gamache RR, Goldman A, Brown L, Toth RA, Pickett HM, PoynterRL, Flaud JM, Camy-Peyret C, Barbe A, Husson N, Rinsland CP, Smith MAH. The HITRAN database: 1986 edition. Appl Opt 1987;26:4058-97.
[10] Bouanich JP, Blanquet G, Walrand J. Theoretical O2– and N2-Broadening Coefficients of CH3Cl Spectral Lines. J Mol Spectrosc 1993;161:416-26.
[11] Colmont JM, Rohart F, Wlodarczak G, Bouanich JP. K-dependence and temperature dependence of N2– and O2-broadening coefficients for the J=14-13 transition of methyl chloride CH335Cl. J Mol Spectrosc 2006;780-781:268-76.
[12] Gamache RR, Davies RW. Theoretical N2-, 02-, and Air-Broadened Halfwidths of 16O3 Calculated by Quantum Fourier Transform Theory with Realistic Collision Dynamics. J Mol Spectrosc 1985;109:283-99.
[13] Tran H, Jacquemart D, Mandin JY, Lacome N. Line-mixing in the ν6 Q branches of methyl bromide broadened by nitrogen: experiment and modelling. JQSRT 2008;109:119-31.
[14] Gomez L, Tran H, Jacquemart D. Line-mixing in the ν6 Q branches of methyl bromide broadened by nitrogen: experiment and modelling at low temperatures.JQSRT to be submitted.
[15] Rosenkranz PW. Shape of the 5 mm Oxygen Band in the Atmosphere. IEEE TRANSACTIONSTRANSACTIONS ON ANTENNAS AND PROPAGATION 1975;AP-23:498-506.
CH3OH (molecule 44) new molecular species in GEISA 2011
The importance of methanol microwave, millimeter wave, sub-millimeter wave and terahertz spectroscopy to space science and astrophysics can be traced back to several decades ago when methanol was first discovered in interstellar clouds and star forming regions [1]. The rich variety of torsion-rotational methanol transitions falling in the frequency bands accessible to most radio and sub-millimeter wave telescopes and notably the new Herschel, ALMA and SOPHIA observatories leads to a dense and detailed interstellar spectrum and demands an accurate knowledge of the methanol energy levels so that the interstellar ‘methanol weeds’ can be removed. The Infrared (IR) spectroscopy of methanol has also acquired renewed importance in wide areas of application in recent years, such as the recent observations of the 10 µm feature in forest fire [2], the influence of biogenic emissions on upper-tropospheric methanol as revealed from space [3], observations in the terrestrial atmosphere [4], the 3 µm features in several comets and the icy mantles of interstellar dust grains [5-8]. These applications require reliable simulation of the absorption band profiles at any prescribed conditions of temperature and density. Achieving reliable calculations in turn requires detailed understanding of the vibration-torsion-rotation structures of the bands, in terms of both the line positions and intensities.
The methanol line list included for the first time in the GEISA database is similar in its origin to that included previously in the HITRAN 2004 version, where miss-assignment of the vibrational levels for pure-rotation lines have been corrected; two duplicate lines have been deleted and two unresolved doublets corrected, as well. The GEISA-2009 methanol line list consists of two regions, 0.019265 – 33.336958 cm-1 and 911.608420 – 1407.205540 cm-1. The first region is based on a global analysis of the first two torsional states of ν12 = 0, and 1 and Jmax = 20 [9] which led to a prediction list to Jmax = 26 at a frequency cutoff of 1 THz [10]. Line strengths in that list were calculated using permanent dipole moment values of µa = 2.999 x 10⁻³⁰ Cm (0.899 D) and µb = -4.803 x 10⁻³⁰ Cm (-1.44 D). The list was aimed at that time to assist the radio astronomy community. More recently, an expanded global analysis with µ 12 = 0, 1, 2 and Jmax = 30 has been published [11]. The second region was built on extensive Fourier transform spectroscopic analyses of methanol spectra in the 10 µm region [12 and references therein]. Due to strong vibration-torsion and rotational interactions, observed 10 µm region transitions arise not only from the ν8 CO-stretch fundamental band, but also from ν8 hot bands and nearby vibrations such as ν5, ν6 and ν7 entering in the region with different ν12 torsional combinations. Within the limits of the isolated vibration-torsion-rotation band model, the predicted positions and intensities unfortunately did not reproduce the spectrum at experimental uncertainties for ν8 and ν8+ν12. In addition to strong and medium intensity transitions of the ν8 and ν8 + ν12 bands, there are many additional transitions appearing with visible intensity in the spectral window; these were identified as belonging to the ν8+2ν12 – 2ν12, ν7 – Ground, ν7+ν12 – ν12, ν6 – ν12, ν6 – 2ν12, ν6+ν12 – ν12, ν5 – 2ν12, 3ν12 – Ground and 4ν12 – Ground bands as indicated in ‘Overall description of available vibrational transitions’ of the methanol database at the GEISA website (http://cds-espri.ipsl.upmc.fr). Many of these transitions are perturbation-induced, gaining intensity via anharmonic and Coriolis interactions with the strong ν8 vibration in the region. Thus, with an isolated-band approach, these transitions cannot be modeled in either position or intensity. Therefore, we have chosen simply to include empirical positions and intensities of these features whenever available in our database.
In arriving at our ultimate 10 µm region database, we took several steps to ensure that the contents reflected our best knowledge of the molecule at the present time (i.e. with observed positions and intensities substituted for predictions whenever available). More specifically, (i) line positions (for 95% of the transitions) were replaced with observed values from the NRC FT spectra except for the congested Q-branch region, in which Q transitions were recomputed from the corresponding observed R- and P-transitions using averaged upper-state term values; (ii) intensities were replaced with measured intensity retrievals from the highest density Kitt Peak spectrum (1.95 Torr, 10 cm). With the predicted database as the input, over 13500 new intensities were retrieved between 970 and 1085 cm-1, including a few lines not currently assigned. Weak lines in the prediction that could not be discerned in the new effort were added to the database with a ‘default intensity’ in order to maintain a complete record of known assignment; the very low intensity value of 10-26 cm-1/(molecule cm-2) was chosen so that these unmeasured transitions would not contribute extra absorption in the radiative transfer calculations for most applications. The database is presented with the following details: molecule number, isotopic species, position (cm-1), intensity (cm-1/(molecule cm-2) at 296 K), dipole matrix element (0 assumed), air-broadened width (0.1 assumed), self-broadened width (0.5 assumed), lower state transition energy (in cm-1 and referenced to 128.1069 cm-1 for the K = 0a level), temperature dependence of width (0.75 assumed), air-broadened pressure-induced frequency shift ( 0 assumed), vibrational index (GROUND, ν12, 2ν12, 3ν12, 4ν12, ν8, ν8+ν12, ν8+2ν12, ν7, ν7+ν12, ν6, ν6+ν12, ν5) for upper and lower states, the torsional symmetry A, E1 or E2, and the overall rotational angular momentum J with component K along the molecular a-axis. Resolved K-doublets of A symmetry have an additional +/- to distinguish the A+ or A- component of the doublet.
References:
[1] Ball JA, Gottlieb CA, Lilley AE, and Radford HE. Detection of methyl alcohol in Sagittarius. Astrophys. J. (Letters) 1970;1962:L203.
[2] Worden H, Beer R, and Rinsland CP. Airborne infrared spectroscopy of 1994 western wildfires. J of Geophys Res 1997;102:1287-99.
[3] Dufour G, Szopa S, Hauglustaine DA, Boone CD, Rinsland CP, and Bernath PF. The influence of biogenic emissions on upper-tropospheric methanol as revealed from space. Atmos. Chem. Phys. 2007;7:6119-29.
[4] Yokelson RJ, Goode JG, Ward DE, Susott RA, Babbitt RE, Wade DD, Bertschi I, Griffith DWT, Hao WM. Emissions of formaldehyde, acetic acid, methanol and other trace gases from biomass fires in North Carolina measured by airborne Fourier transform infrared spectroscopy (AFTIR). J Geophys Res-Atmos 1999;104:30109-125.
[5] Mumma MJ, McLean IS, DiSanti MA, Larkin JE, Dello Russo N, Magee-Sauer K, Becklin EE, Bida T, Chaffee F, Figer DF, Gilbert AM, Graham JR, Levenson NA, Novak RE, Reuter DC, Teplitz HI, Wilcox MK, Xu LH. The Startling Organic Composition of C/1999 S4 (Linear): A Comet Formed Near Jupiter ?. Astrophys J 2001;546:1183-93.
[6] Reuter DC. The contribution of methanol to the 3.4 µm emission feature in comets. Astrophys J 1992;386:330-35.
[7] Gibb EL, Whittet DCB, Schutte WA, Boogert ACA, Chiar JE, Ehrenfreund P, Gerakines PA, Keane JV, Tielens AGGM, van Dishoeck DF and Kerkhof O. An inventory of interstellar ices toward the embedded protostar W33A. Astrophys J 2000;536:347-56.
[8] Bockelée-Morvan D, Lis DC, Wink JE, Despois D, Crovisier J, Bachiller R, Benford DJ, Biver N, Colom P, Davies JK, Gerard E, Germain B, Houde M, Moreno R, Paubert G, Phillips TG, and Rauer H. New molecules found in comet C/1995 O1 (Hale-Bopp) – Investigating the link between cometary and interstellar material. Astron and Astrophys 2000;353:1101-14.
[9] Xu LH, Hougen JT. Global Fit of Rotational Transitions in the Ground and First Excited Torsional States of Methanol. J Mol Spectrosc 1995;173:540-51.
[10] Xu LH, Lovas FJ. Microwave Spectra of Molecules of Astrophysical Interest XXIV: Methanol (CH3OH and 13CH3OH). J Phys Chem Ref. Data 1997;26:17-156.
[11] Xu LH, Fisher J, Lees RM, Shi HY, Hougen JT, Pearson, JC, Drouin BJ, Blake GA, Braakman R. Torsion-Rotation Global Analysis of the First Three Torsional States (νt = 0, 1, 2) and Terahertz Database for Methanol. J Mol Spectrosc 2008;251:305-13.
[12] Xu LH, Lees RM, Wang P, Brown LR, Kleiner I, Johns JWC. New Assignments, Line Intensities and HITRAN Database for CH3OH at 10 µm. J Mol Spectrosc 2004;228:453-70 and references therein.
NO+ (molecule 45) new molecular species in GEISA 2011
Author: J-M Flaud
Acknowledgements: M Lopez-Puertas
In a recent paper Lopez Puertas et al. [45-JMF-1], using high resolution (0.035 cm-1 unapodized) spectra of the earth atmosphere recorded by the MIPAS experiment have obtained line positions of ro-vibrational NO+ transitions with an unprecedented accuracy. It was found that the spectral line positions of the NO+ (1-0) ro-vibrational band are shifted by about 0.15 cm-1 with respect to those listed in the previous database compilations. Also, spectral line positions of the NO+ (2-1) ro-vibrational band were found to be shifted by approximately 0.05-0.1 cm-1 with respect to those listed in the previous compilations. A new set of Hamiltonian constants for NO+ was derived from a fit of the MIPAS data together with the existing microwave and infrared data (see [1] for details). These Hamiltonian constants were hence used to generate new line positions for transitions with J≤ 40. Lines with J” greater than 40 were kept from the previous compilation since the new constants cannot predict accurate frequencies for high-J values. It is clear that new high resolution spectra of the NO+ species are needed in order to improve its spectral parameters.
References
[1] Lopez-Puertas M, Flaud J-M, Peralta-Calvillo J, Funke B and Gil-Lopez S. NO+ fundamental and first hot ro-vibrational line frequencies from MIPAS/Envisat atmospheric spectra. J Mol Spectrosc 2006;237:218-24.
HNC (molecule 46) new molecular species in GEISA 2011.
Authors: J. Tennyson and G. Harris
Although HCN and HNC actually lie on a single potential energy surface, they are separated by a significant barrier (Van Mourik et al. [1]). Within GEISA 2011 they are treated as separate species and HNC is a new molecular species for this new edition of GEISA. HNC is the less stable isomer but is known to be overabundant compared to HCN in the interstellar medium (e.g. Hirota et al. [2]). Furthermore the partition function of HNC increases much more rapidly with temperature than that of HCN meaning that at temperatures of about 2500 K, the equilibrium abundance of HNC should be about 20% of HCN (Barber et al. [3]). The spectrum of HNC has been identified in carbon stars (Harris et al. [4]).
The GEISA 2011 HNC line list has been elaborated by Harris [5] for the main isotopic species H14N12C. Among an initial total of 9117 entries, in the spectral range 0.216955-12594.316928 cm-1, 3498 have been implemented in a supplemental line list because they did not have upper vibrational states identification. Consequently, the final GEISA 2011 archived HNC data omprises 5619 entries in the spectral range 0.216955 – 4814.904168 cm-1.
As for HCN, the GEISA-08 HNC line list was constructed from a combination of experimental and theoretical data. The theoretical data are taken exclusively from the line list of Harris et al. [6]. Experimental data are used in preference to the ab initio data when they are available. The GEISA 2011 HNC data is less extensive than that for HCN; it is also less accurate since there is substantially less laboratory data to base it on. The spectral region covered for HNC is 0.217 to 12594 cm-1. Hot bands with a lower vibrational state of 2 quanta of bend, are given for most of the transitions.
The GEISA 2011 HNC line list was constructed in the following stages.
1. Construction of a list of laboratory determined energy levels.
The laboratory line frequency measurements of Northrup et al. [7] were used to determine a set of experimental HNC energy levels. This was done by using a technique that deviates only slightly from that of Harris et al [8]; the rotational constants are used to compute energy levels up to an angular momentum quantum number of 60.
2. Construction of a list of laboratory determined line frequencies.
Using the laboratory determined energy levels it is straight forward to compute a list of line frequencies for dipole allowed transitions. The well known selection rules for dipole transitions require a change in symmetry and allow a change in angular momentum of 0, +/- 1. When applied to HNC the allowed transitions form two groups. The first has a change in parity of the vibrational angular momentum with no change in total angular momentum. The second group has no change in the parity of the vibrational angular momentum, but a change of plus or minus one in total angular momentum. For all the dipole allowed transitions between laboratory determined energy levels, line frequencies were computed by subtracting lower state energy from upper state energy.
3. Construction of a list of laboratory determined line strengths.
A list of line strengths were computed from laboratory data given by Nezu et al. [9,10]. This data is given in the form of band dipoles that are supplemented with Hermann-Wallis factors. From this data, the line strengths of individual lines were computed by using the relevant Hönl-London factor and the equation given by Maki et al. [11].
4. Construction of laboratory determined line list.
The laboratory determined line strengths were inserted into the list of laboratory determined energy levels. In this way, an HNC line list based upon laboratory measurements was created.
5. Augmentation of the laboratory determined line list with ab initio line strengths.
Many of the intensities for the dipole allowed bands have not been measured. The resulting gap in the laboratory determined line list may only be filled by ab initio data.
Many of the transitions in the ab initio line list of Ref. [6] have been assigned an approximate vibrational quantum number. We were therefore able to insert the line strengths from Ref. [6] line list into the GEISA 2011 final HNC file, creating a more complete list of lines.
6. Augmentation with ab initio data and truncation.
The upper and lower energy levels for many strong room temperature lines have not been determined. In order to account for these strong lines the HNC GEISA line list was augmented with purely ab initio line frequency and intensity data from Ref. [6]. Finally, to cut down the size of the final line list, a minimum line intensity of 10-30 cm per molecule was chosen. Lines with intensities below this level were removed form the final HNC GEISA 2011 archive.
References
[1] Van Mourik T, Harris GJ, Polyansky OL, Tennyson J, Csaszar AG and P.J. Knowles PJ. Ab initio global potential, dipole, adiabatic and relativistic correction surfaces for the HCN/HNC system. J. Chem Phys 2001;115:3706-18.
[2] Hirota T, Yamamoto S, Mikami H, Ohishi M. Abundances of HCN and HNC in dark cloud cores, Astrophys J 1998;503:717-28.
[3] Barber RJ, Harris GJ and Tennyson J. Temperature dependent partition functions and equilibrium constant for HCN and HNC. J Chem Phys 2002;117:11239-43.
[4] Harris GJ, Pavlenko YV, Jones HRA and Tennyson J. The identification of HCN and HNC in carbon stars: Model atmospheres, synthetic spectra and fits to observations in the 2.7-4.0 µm region. Mon. Not R astr Soc 2003;344:1107-18.
[5]Harris G. Private communication, 2008.
[6] Harris GJ, Polyansky OL and Tennyson J. Opacity data for HCN and HNC from a new ab initio linelist. Astrophys J 2002;578: 657-63.
[7] Northrup FJ, Bethardy GA, Macdonald RG. Infrared absorption spectroscopy of HNC in the region 2.6 to 3.1 mm. J Mol Spectrosc 1997;186:349-62.
[8] Harris GJ, Tennyson J, Kaminsky BM, Pavlenko YaV, Jones HRA. Improved HCN/HNC linelist, model atmsospheres synthetic spectra for WZ Cas. Mon Not R astr Soc 2006;367:400-6.
[9] Nezu M, Amano T, Kawaguchi K. Transition dipole moments for the vibrational fundamentals of HNC determined from the Hermann-Wallis effect. J Mol Spectrosc 1998;192:41-6.
[10] Nezu M, Amano T, Kawaguchi K. On “transition dipole moments for the vibrational fundamentals of HNC determined from the Hermann-Wallis effect”. J Mol Spectrosc 1999;198:186-186.
[11] Maki A, Quapp W, Klee S. Intensities of hot-band transitions: HCN hot bands. J Mol Spectrosc 1995;171:420-32.
C6H6 (molecule 47) new molecular species in GEISA 2011
Author: A. Coustenis
Benzene is introduced in GEISA 2011 for the first time.
Line parameters for the ν4 band of benzene near 678 cm-1 were provided by M. Dang-Nhu (private communication) and generated from the molecular constants and band strength compiled in Dang-Nhu and Plíva [1].
As concerns the absolute intensities two approaches have been used. Dang-Nhu et al. [2] made a line-by-line study, using a very high resolution tunable diode laser which yielded 30 individual intensities, from which a vibrational strength was derived (see also [1]). At the same time, a study at medium resolution (1 cm-1) performed on spectra recorded at LISA by Raulin et al. [3] provided the integrated band intensity of benzene in the spectral region which was related to the previous one through the vibrational partition function.
This dataset was first applied to modeling of the Titan spectrum in Coustenis et al. [4,5]; see there figures 5, 6, 8, 9 and 11a. Polycyclic aromatic hydrocarbons (PAHs) are important interstellar species, and their precursor benzene (C6H6) has been detected in our solar system, in particular on Titan. Benzene was identified on Titan through ISO and Cassini/CIRS data (Coustenis et al. [5,6]).
References
[1] Dang-Nhu M, Plíva J. Intensities in the ν4, ν12, ν13, and ν14 bands of benzene. J Mol Spectrosc 1989;138:423-29.
[2] Dang-Nhu M, Blanquet G, Walrand J, Raulin F. Spectral intensities in the ν4 band of benzene at 15 μm. J Mol Spectrosc 1989;134:237-9.
[3] Raulin F, Accaoui B, Razaghi A, Dang-Nhu M, Coustenis A, Gautier D. Infrared spectra of gaseous organics: application to the atmosphere of Titan. II C4 alkanenitriles and benzene. Spectrochimica Acta 1990;46:671-83.
[4] Coustenis A, Encrenaz Th, Bézard B, Bjoraker, Graner G, Dang-Nhu M, Arié E. Modeling Titan’s thermal infrared spectrum for high-resolution space observations. Icarus 1993;102:240-60.
[5] Coustenis A, Salama A, Schulz B, Ott S, Lellouch E, Encrenaz Th, Gautier D, Feuchtgruber H. Titan?s atmosphere from ISO mid-infrared spectroscopy. Icarus 1993;161:383-403.
[6] Coustenis A, Achterberg R, Conrath B, Jennings D, Marten A, Gautier D, Bjoraker G, Nixon C. Romani P, Carlson R, Flasar M, Samuelson RE, Teanby N, Irwin P, Bézard B, Orton G, Kunde V, Abbas M, Courtin R, Fouchet Th, Hubert A, Lellouch E, Mondellini J, Taylor FW, Vinatier S. The composition of Titan’s stratosphere from Cassini/CIRS mid-infrared spectra. Icarus 2007;189:35-62.
C2HD (molecule 48) new molecular species in GEISA 2011
Authors: A. Jolly, A. Fayt and M. Herman.
Acknowledgements: Séverine Robert and Filipo Tamassia
The line list of monodeuterated acetylene is new in the GEISA database. The need for a line list of deuterated acetylene appeared following the recent detection of the isotopologue in the atmosphere of Titan by Coustenis et al. [1]. The line list has been assembled by a joint effort of different laboratories [2]. It is based on new band intensity measurements performed at a resolution of 0.5 cm-1 in Paris and a new analysis done in Brussels of the high resolution spectra of C2HD recorded in Bologna [2]. The new global fit was obtained by using the computer package developed in Louvain la Neuve and dedicated to both energy and intensity treatments [3,4]. Included lines belong to both bending modes μ4 and μ5 which could be detected on Titan thanks to their strong Q-branch at 519 and 678 cm-1 respectively. Lines belonging to both strong stretching modes μ-1 and μ3 centred at 3335.6 and 2583.6 cm-1 respectively are also present in the new line list. A total of 15512 lines are present in the list with a minimum intensity of 1.6 10-25 (cm2/molecule cm-1 at 296 K). All five vibrational modes and both ι values are used in the vibrational assignment of the upper and the lower level of each transition (v-1, v2, v3, v4, v5, ι4, ι5).
The study of deuterated acetylene in planetary atmospheres is of great importance and in particular the determination of D/H isotopic ratios. The recent detection of 12C2HD in Titan enabled to determine a value of D/H [1]. It could be compared to the values obtain for CH4(CH3D) and H2(HD) as C2HD is only the third deuterated molecule to be detected in Titan’s atmosphere.
References
[1] Coustenis A, Jennings DE, Jolly A, Bénilan Y, Conor AN, Vinatier S, Gautier D, Bjoraker, GL, Romani PN, Carlson RC, Flasar MF. Detection of C2HD and the D/H ratio on Titan. Icarus 2008;197:539-48.
[2] Jolly A, Benilan Y, Cané E, Fusina L, Tamassia F, Fayt A, Robert S, Herman M.Measured integrated band intensities and simulated line-by-line spectra for C2HD between 25 and 2.5 μm, and new global vibration rotation parameters for the bending vibrations. JQSRT 2008;109:2846-56.
[3] Fayt A, Vigouroux C, Willaert F, Margules L, Lucian Florin Constantin L-F, Demaison J, Pawelke G, Mkadmi ELB, Bürger H. Global analysis of high resolution infrared and rotational spectra of HCCC15N up to 1335 cm-1. J Mol Struct 2004;695-696:295-311.
[4] Fayt A, Vigouroux C, and Winther F. Analysis of the n9 band complex of dicyanoactylene and application of a theory of relative intensities to all sub-bands. J Mol Spectrosc 2004;224:114-30.
CF4 (molecule 49) new molecular species in GEISA 2011.
Author: V. Boudon
In the previous editions of the GEISA database, tetrafluorocarbon (CF4) was referred to as CFC 14 and was only included in the cross-sections part [1], with no line list. It is, however, a strong greenhouse gas of both anthropogenic and natural origin [2,3]. Its concentration is increasing in the atmosphere [4,5]. Although it has been indentified and measured from balloon-borne measurements [6], its spectroscopy remains only very partly investigated, quite for the same reasons as for SF6 (presence of many hot bands, dense spectrum with clustered lines). Its infrared spectrum is dominated by the strong ν3 stretching fundamental band at 1282 cm-1 [6], this band being strongly coupled with the first overtone of the ν4 bending mode.
The ν4 (around 15.8 µm) and 2ν4/ν3 regions (around 7.3 µm) have been recently reinvestigated, thanks to several new Fourier transform infrared spectra recorded at a resolution of 0.003 cm-1. Just as in the previous work of Gabard et al. [7], a simultaneous analysis of the ground state, ν4, ν3, 2ν4 and ν3 – ν3 bands was performed, thanks to the XTDS and SPVIEW programs [8] developed by the University of Burgundy group. Compared to Ref. [7], the present work extends the analysis to much higher J values (70 instead of 40 for ν4 and 63 instead of 32 for the 2ν4/ν3 dyad). As for absorption intensities, it was possible to go a bit further than for SF6. By calculating synthetic spectra for exactly the same physical conditions as for the experiment, it was possible to fit the ν4 and ν3 dipole-moment derivatives. The results compare very well to the literature values of Papoušek et al. [9]. The details of this new analysis will be given in a forthcoming paper [10].
This analysis allowed to generate the first reliable line list for 12CF4 that covers the spectral ranges 600 to 670 cm-1 (ν4) and 1276 to 1290 cm-1 (2ν4/ν3). Tetrafluorocarbon becomes GEISA 2011 molecule number 49. The precision for line positions is estimated to be around 0.001 cm-1, up to J = 60. The intensity accuracy, however, may not be better than 20 %, especially for the high-J regions. Line-broadening coefficients were taken from Reference [11]. The newly archived CF4 line list comprises 60,033 entries in the spectral range 594-1312 cm-1.
References
[1] Brown LR, Farmer CB, Rinsland CP, Toth RA. Molecular Line Parameters for the Atmospheric Trace Molecule Spectroscopy (ATMOS) Experiment. Appl Opt 1987;26:5154-82.
[2] Worton DR, Sturges WT, Gohar LK, Shine KP, Martinerie P, Oram DE, Humphrey SP, Begley P, Gunn L, Barnola JM, Schwander J, Mulvaney R. Atmospheric trends and radiative forcings of CF4 and C2F6 inferred from firn air. Environ Sci Technol 2007;41:2184-9.
[3] Cicerone RJ. Atmospheric Carbon Tetrafluoride: A Nearly Inert Gas. Science 1979;206:59-61.
[4] Zander R, Solomon S, Mahieu E, Goldman A, Rinsland CP, Gunson MR, et al. Increase of stratospheric carbon tetrafluoride (CF4) based on ATMOS observations from space. Geophys Res Lett 1996;23:2353-6.
[5] Rinsland CP, Mahieu E, Zander R, Nassar R, Bernath P, Boone C, et al. Long-term stratospheric carbon tetrafluoride (CF4) increase inferred from 1985-2004 infrared space-based solar occultation measurements. Geophys Res Lett 2006;33:02808.
[6] Goldman A, Murcray DG, Murcray FJ, Cook GR, van Allen JW, Bonomo FS, et al. Identification of the ν3 vibration-rotation band of CF4 in infrared balloon-borne solar spectra. Geophys Res Lett 1979;6:609-12.
[7] Gabard T, Pierre G, Takami M. Study of the ν3 and 2 ν4 interacting states of 12CF4. Mol Phys 1995;85:735-44.
[8] Wenger C, Boudon V, Rotger M, Sanzharov M, Champion JP. XTDS and SPVIEW: Graphical tools for the analysis and simulation of high-resolution molecular spectra. J Mol Spectrosc 2008;251:102-13.
[9] Papoušek D, Papouskova Z, Chong DP. Density functional computations of the dipole moment derivatives for halogenated methanes. J Phys Chem 1995;99:15387-95.
[10] Boudon V, Domanskaya A, Maul C, Georges R, Mitchell J, Harter WG. High-resolution spectroscopy and analysis of the 2ν4/ν3 dyad of CF4, in preparation.
[11] Höjer S, May RD. Air-Broadening Coefficients for the ν3 Band of CF4. J Mol Spectrosc 1996;178:139-42.
CH3CN (molecule 50) new molecular species in GEISA 2011
Authors: C. Benner, L.R. Brown, A. Kleinbühl, I. kleiner, C.P. Rinsland
Methyl cyanide or acetonitrile, CH3CN, is a new entry in GEISA 2011. Until recently the spectroscopic line parameters for CH3CN (acetonitrile, methyl cyanide, ethanenitrile) were not part of public databases such as GEISA [1] or HITRAN [2]. Methyl cyanide is a molecule of astronomical and atmospheric importance.
Line parameters of CH3CN are needed for planetary studies because this species has been observed, by heterodyne millimeter wave spectroscopy from the ground [3], on Titan. The dissociation of N2 leads to the formation of nitriles such as HCN, HC3N and C2N2, identified for the first time by the Voyager probes in the earlier 80’s. One of the goals of the Cassini mission (http://www.esa.int/SPECIALS/Cassini-Huygens/index.html, investigating the Saturn system between 2004 and 2008, was to map all the photochemical compounds, hydrocarbons and nitriles, in order to better understand the photochemical cycle of Titan and its coupling with the dynamics and the production of organic aerosols [(4-5)]. CH3CN has been measured by remote sensing in comets [6], and in interstellar molecular clouds [7], as well.
CH3CN is also a gas present in the Earth atmosphere with a lifetime of several months, mainly emitted through forest fires and then probably deposited in the oceans. Since 1993, this molecule has been classified as an atmospheric pollutant and is the object of a number of various chemical, biological and atmospheric [(8-11)] studies.
The GEISA 2011 CH3CN line list consists of spectroscopic parameters of two different origins.
First origin: as the result of a multispectrum nonlinear least squares fitting technique applied to measure accurate zero-pressure line center positions, Lorentz self- and N2-broadening coefficients and self- and N2-pressure-induced shift coefficients, 3571 features have been archived in the ν4 parallel band region between 890 and 946 cm-1. Published line positions and intensities from Rinsland et al. [12] have been supplemented by unpublished measurements from the same dataset, as well as selected values from preliminary Hamiltonian calculations. Only lines with intensities greater than 10-24 cm/molecule at 296 K are included. The spectral region from 918.5 to 920.3 cm-1 (containing the Q branch and the P1 and P2 manifolds) proved too dense to measure directly and so these parameters are represented by 326 calculated transitions of ν4. Some 2243 lines are given without quantum identifications; many are thought to be hot band lines involving as yet unanalyzed upper state levels of ν4+ν8. The lower state energy of these unidentified lines is set to the GEISA 2011 standard missing value, i.e.: -0.9999. It should be noted that a number of hot-band lines are not included in the list; this is most noticeable at the hot band Q branch near 924 cm-1. Measured self-broadening coefficients were available, and identified lines with the same K quantum number and the same or very close m were assigned approximately the same or interpolated values. The total number of lines with self-broadening assigned in this manner is 2185. For the lines lacking measured or estimated Lorentz half width coefficients for air- and self- broadening, default values of 0.14 and 1.5 cm-1 atm-1 at 296 K were used, respectively (obtained as an approximate average of measured values). The measured N2 shifts [12], where available, were inserted for air shifts. Unmeasured pressure shifts are set to zero, the approximate average of the measured values. There are no measurements of the temperature dependence of the Lorentz half width in air and only one in N2 [13], so the default n is set to the single measured N2 value of 0.72.
Second origin: an excerpt in the spectral range of 970 – 1650 cm-1 of an empirical ‘pseudo-linelist’ (total extent 870 – 1650 cm-1), where the ν7 band around 1050 cm-1 and the ν3, ν 6, ν 7+ν 8 bands around 1450 cm-1 are located. This represents a total of 13601 entries. A pseudo-linelist, typically derived by fitting equally spaced “pseudo-lines” to laboratory spectra, is not intended to supplant any proper quantum-mechanically based linelist. However, it provides a convenient means for radiative transfer calculations in case quantum-mechanically derived linelists are unavailable or unreliable. In the process of building up the GEISA 2011 CH3CN linelist, the mixing of quantum-mechanically derived lines and pseudo-lines has been avoided, as one cannot expect to get realistic results in a radiative transfer calculation if the quantum-mechanically derived lines have not been taken into account during the derivation of the pseudo-lines. The pseudo-linelist for CH3CN has been successfully used to identify and quantify CH3CN in the Earth’s atmosphere from balloon-borne solar occultation Fourier-Transform infrared measurements [11].
The CH3CN pseudo-linelist [14] was created based on 29 laboratory spectra taken at the Pacific Northwest National Laboratory (PNNL). The measurements and the absorption cross sections, including assignments of major bands, are described by Rinsland et al. [15]. The cross-sections were converted back into transmittance spectra from knowledge of the cell length and gas concentrations. The resulting laboratory transmittance spectra were then simultaneously fitted by iteratively adjusting the strengths and ground-state energies of the pseudo-lines. At each line frequency, an effective strength and ground-state energy was derived by simultaneous non-linear least squares fitting to the 29 spectra. The air-broadened half-width was calculated from the ground-state energy using a simple parameterization that results in ABHWs between 0.04 and 0.08 cm-1/atm and gives the most appropriate fit to the narrowest features in the considered frequency region. The self-broadened half-width, the temperature dependency of the ABHW, and the pressure shift were chosen to be values that are typical for heavy molecules.
Due to the resolution of the laboratory spectra of 0.1125 cm-1 and their spectral point spacing of 0.0603 cm-1, a pseudo-line spacing of 0.05 cm-1 was considered to be appropriate. Note that when the pseudo-linelist is used in radiative transfer calculations, it is recommended that the Doppler-width of the lines is set to the value of the pseudo-line spacing. Otherwise calculations for low pressures will lead to unrealistic spikes at the positions of the individual pseudo-lines.
References
[1] Jacquinet-Husson N, Scott NA, Chédin A, Crépeau L, Armante R, Capelle V et al. The GEISA spectroscopic database: Current and future archive for Earth and planetary atmosphere studies. JQSRT 2008;109:1043-59.
[2]Rothman LS, Jacquemart D, Barbe A, Chris Benner D, Birk M, Brown LR, et al. The HITRAN 2004 molecular spectroscopic database. JQSRT 2005;96:139-204.
[3] Marten A, Hidayat T, Biraud Y, Moreno R. New Millimeter Heterodyne Observations of Titan: Vertical Distributions of Nitriles HCN, HC3N, CH3CN, and the Isotopic Ratio 15N14N in Its Atmosphere. Icarus 2002;158:532-44.
[4] Coustenis A, Achterberg RK, Conrath BJ, Jennings DE, Marten A, Gautier D, Nixon CA, Flasar FM, Teanby NA, Bézard B, Samuelson RE, Carlson RC, Lellouch E, Bjorker GL, Romani PN, Taylor FW, Irwin PGJ, Fouchet T, Hubert A, Orton GS, Kunde VG, Vinatier S, Mondellini J, Abbas MM, Courtin R. The composition of Titan’s stratosphere from Cassini/CIRS mid-infrared spectra. Icarus 2007;189:35-62 (doi: 10.1016/j.icarus.2006.12.002).
[5] Teanby NA, Irwin PGJ, R. Kok R, Nixon CA, Coustenis A, Bézard B, Calcutt SB, Bowles NE, Flasar FM, Fletcher L, Howett C, Taylor FW. Latitudinal variations of HCN, HC3N and C2N2 in Titan’s stratosphere derived from Cassini CIRS data. Icarus 2006;181:243-55
[6] Crovisier J. Physics and chemistry of comets: recent results from comets Hyakutake and Hale-Bopp. Faraday Discuss 1998;109:437-52.
[7] Watson C, Churchwell E, Pankonin V, Bieging JH. Arcsecond images of CH3CN toward W75N. Astrophys J 2002;577:260-4.
[8] H. W. Bange, J. Williams, New Directions: Acetonitrile in atmospheric and. biogeochemical cycles, Atmospheric Environment, 34 (2000) 4959-4960
[9] Livesey NJ, Waters JW, Rhosvari R, Brasseur GB, Tyndall TS, Read W. Stratospheric CH3CN from the UARS microwave limb sounder. Geophys Res Lett 2001;28:779-82.
[10] Livesey NJ, Fromm MD, Waters JW, Manney GL, Santee ML, Read WG. Enhancements in lower stratospheric CH3CN observed by the upper atmosphere research satellite microwave limb sounder following boreal forest fires. J Geophys Res 2004;109: (Paper No. 10.1029.2003JD004055).
[11] A. Kleinbühl, G. C. Toon, B. Sen, J-F. Blavier, D. K. Weisenstein, P. O. Wennberg, Geophys. Res. Lett. , Infrared measurements of atmospheric CH3CN, Geophys. Res. Lett 32 (2005) L23807
[12] Rinsland CP, Devi VM., Benner DC, Blake TA, Sams RL, Brown LR, Kleiner I, Dehayem-Kamadjeu A, Müller HSP, Gamache RR, Niles DL, Masiello T. Multispectrum analysis of the ν4 band of CH3CN: Positions, intensities, self- and N2-broadening and pressure-induced shifts. JQSRT 2008;109:974-994
[13] Colmont JM, Rohart F, Wlodarczak, Boyanich JP, K-Dependence and temperature dependence of N2-, H2– and He-broadening coefficients for the J = 12-11 transition of acetonitrile CH3C14N located near 2007. GHz. J Mol Spectrosc 2006;238:87-107.
[14] Kleinbühl A., Private communication, 2008.
[15] Rinsland CP, Sharpe SW, Sams RL. Temperature-dependent infrared absorption cross sections of methyl cyanide (acetonitrile). JQSRT 2005;96:271-80.